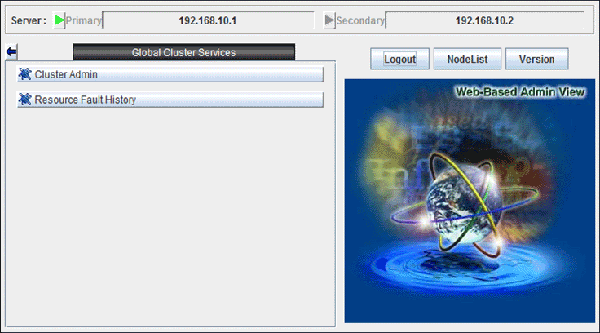
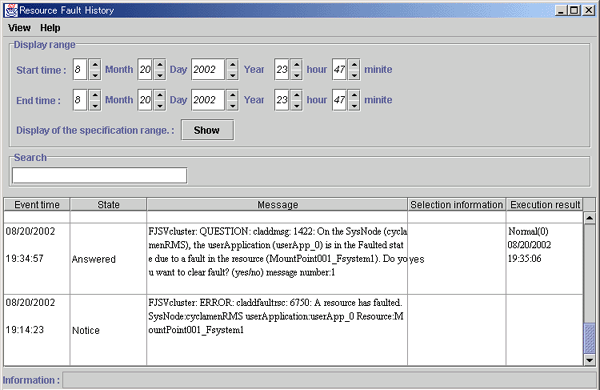
Display the "Resource Fault History" screen, in which the resource fault history is displayed, in the following procedure.
Procedure
Open the "Web-Based Admin View" screen and then select Global Cluster Services.
Choose Resource Fault History.

The "Resource Fault History" will be displayed.

Note
The "Resource Fault History" cannot be displayed automatically. To display the latest history information, select View -> Update menu.
Menu of the fault resource list screen
The "Resource Fault History" screen contains the following menu items:
Menu | Function |
|---|---|
View -> Update latest information | The duration is initialized to the present time and date. A maximum of 100 of the latest history resources are displayed. |
View -> Fault Resource List | A list of resources in which failures are present is displayed (see "C.2.3 Fault Resource List"). |
View -> Exit | The "Resource Fault History" screen is cleared. |
Help -> Help | The GUI help screen is displayed. |
Setting the range of time
A fault resource history listing can be displayed by specifying a date and time.
Start time - A start time is set up.
End time - An end time is set up.
If you click the View button after setting up the required values, a maximum of 100 of the most recently failed resources within the specifiable range can be displayed.
Search with a keyword
The fault resource history list can be narrowed by specifying "Keyword".
If a duration is set, the history of up to the 100 latest failed resources that satisfy both conditions can be displayed.
How to read the list
The following information is displayed on the "Resource Fault History" screen.
Event time - The time at which the RMS detected a resource failure is displayed.
State - One of the following statuses is indicated.
Responded - The operator has already responded the message.
Not responded - The operator has not responded to the message for which a response is required.
Responding - The operator is currently responding to the message.
Confirm - Notification message for which no response is required.
Message - The message is displayed.
Selection information - Operator intervention message information from the client that is connected to the management server is displayed. If the message is canceled or if a response to the message is entered by executing the "clreply" command, nothing will be displayed.
Execution result - The result and time of the response processing are displayed.
Information field
The information related to error detection during the acquisition or read-in of the history files is displayed. The following items will be displayed:
Processing - History data is being collected from the management server.
An error is included in the specified duration. - The specified duration is incorrect. Correct it and then click the View button.
Part of the data acquisition failed. - Parts of the history files could be damaged. This will not disrupt ongoing operation, but the corrupted data will not be displayed.