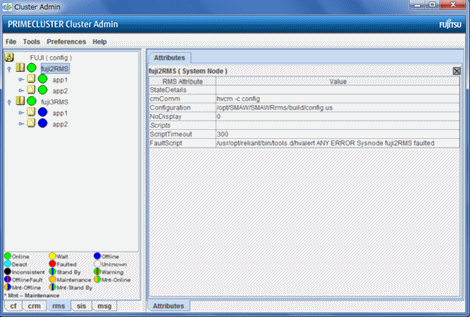
The RMS main window consists of the following elements:
RMS tree
Configuration information or object attributes
Switchlogs and application logs
The RMS tree displays the configuration information of the cluster in a hierarchical format. The tree has the following levels:
Root of the tree - Represents the cluster.
First level - Represents the system nodes in the cluster.
Second level - Represents the userApplication objects running on each of the system nodes.
Third level - Represents the sub-applications (an aggregation of objects if any exist).
Fourth level - Represents the resources required for each of the sub-applications.
If an application has sub-applications, the fourth level represents resources used by that sub-application. If an application does not have sub-applications, then the third level represents all the resources used by userApplication.
Dependency relationships between cluster applications are indicated by controller objects in the RMS tree.
Figure 7.1 RMS main window
Meanings of object icons
Icon | Meaning |
|---|---|
| Represents the cluster. |
| Represents a node. |
| Represents a parent object (cluster application) that has a child object. |
| Represents a child object (cluster application or resource). |
| Represents a leaf object (cluster application or resource). |
| Represents a controller object (cluster application). |
Meanings of state display icons
On the right side of the object icons shown above is displayed a color-coded circle that indicates the state of each object. This section describes the meaning of the colored circles (state display icons).
Information
State display icons are not displayed in cluster icons. Instead, the RMS cluster table can be displayed. For details, see "7.3.3 Concurrent Viewing of Node and Cluster Application States."
Node state display
The state icons that are displayed in nodes are shown below.
Icon | Icon color | Outline | Details |
|---|---|---|---|
Node |
| Online | Node is enabled and ready for use. |
| Offline | Node is enabled but RMS is disabled. | |
| Faulted | Node is disabled.
| |
| Wait | Node is undergoing a state transition. |
Note
The node states in the RMS main window of Cluster Admin may be displayed as Unknown. In this case, exit the Web-Based Admin View screen and restart. If the node states in the RMS main window of Cluster Admin are still displayed as Unknown, check the node states by using hvdisp -a.
State display of other objects
The following state icons are displayed with object icons that fall under parent objects.
Icon | Icon color | Outline | Details |
|---|---|---|---|
|
| Online | Object is enabled and ready for use. |
| Warning | Object has exceeded some warning threshold. | |
| Offline | Object is disabled and should not be used. | |
| Faulted | Object encountered an error condition. | |
| Unknown | Monitoring and control are not being executed for the object. | |
| Wait | Node is undergoing a state transition. | |
| Deact | Node is deactivated because of maintenance, etc. | |
| Inconsistent | Node state is inconsistent. | |
| Stand By | Object is in such a state that it can be quickly brought Online when needed. | |
| OfflineFault | Object is Offline, but a fault has occurred before and is not cleared yet. | |
| Maintenance | Object is in maintenance mode. | |
| Maintenance-Online | Object is in maintenance mode and must be Online when exiting maintenance mode. | |
| Maintenance-Offline | Object is in maintenance mode and must be Offline when exiting maintenance mode. | |
| Maintenance-Stand By | Object is in maintenance mode and must be Stand By when exiting maintenance mode. |
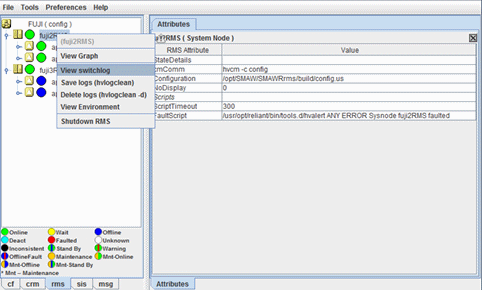
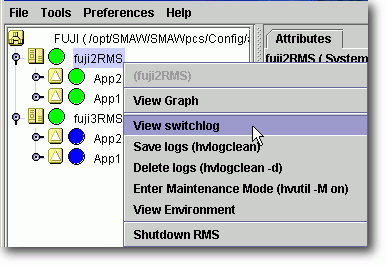
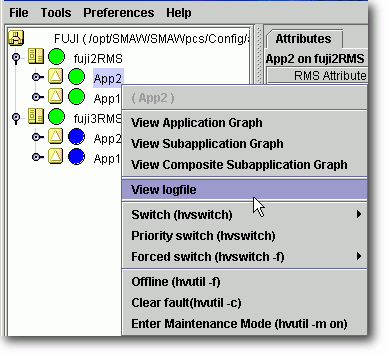
Pop-up menu
If you right-click an object in the RMS tree, a pop-up menu lists the operations for that object. You can also use this menu for monitoring the state.
Note
The following icons may be displayed in the userApplication object or the gResource object.
![]() : This icon is displayed at the right side of the userApplication object state icon. It means that only some resources under the userApplication are started. For details, see "7.2.3 Resource Operation."
: This icon is displayed at the right side of the userApplication object state icon. It means that only some resources under the userApplication are started. For details, see "7.2.3 Resource Operation."
![]() : This icon is displayed at the right side of the gResource object. It means that a resource fault occurred in the past. For details, see "8.3.5 Fault Traces of Resources" in "PRIMECLUSTER Reliant Monitor Services (RMS) with Wizard Tools Configuration and Administration Guide."
: This icon is displayed at the right side of the gResource object. It means that a resource fault occurred in the past. For details, see "8.3.5 Fault Traces of Resources" in "PRIMECLUSTER Reliant Monitor Services (RMS) with Wizard Tools Configuration and Administration Guide."
![]() : This icon is displayed at the right side of the userApplication object state icon. It means that status of some resources in the userApplication has changed from the status just before the start of maintenance mode. To exit the maintenance mode, all the resource status in userApplication must be changed back to the original status just before the start of maintenance mode. For more information, refer to "7.2.2.6 Entering maintenance mode for Cluster Application."
: This icon is displayed at the right side of the userApplication object state icon. It means that status of some resources in the userApplication has changed from the status just before the start of maintenance mode. To exit the maintenance mode, all the resource status in userApplication must be changed back to the original status just before the start of maintenance mode. For more information, refer to "7.2.2.6 Entering maintenance mode for Cluster Application."
![]() : Though this icon indicates that the resource fault occurred in the past, it has nothing to do with the current state of the resource.
: Though this icon indicates that the resource fault occurred in the past, it has nothing to do with the current state of the resource.
For this reason, this icon is subsequently shown as "Fault Traces of Resources."
If you want to check the current state of the resource, check the resource object state.
This icon is hidden in any of the following cases:
After executing the Online processing of the resource.
After clearing the fault trace resources manually. For details, see "7.2.3.3 Clearing Fault Traces of Resources." Even when the icon is shown, unlike the Faulted state of cluster applications(*), there is no influence on switchover activities of cluster applications. Therefore, if you do not need to display the icon, clear it manually.
(*) When the cluster application is in the Faulted state, you need to clear the Faulted state if you specify the cluster application for switchover again.
View the configuration information for the individual objects by left-clicking the object in the RMS tree. The properties are displayed in a tabular format on the right-hand side panel of the RMS main window.
Each node has a log file referred to as the switchlog. In this file, switchover requests and node failures are recorded. The switchlog is displayed in a tab on the right-side panel.
Display the application log by right-clicking on an application on the RMS tree and choosing View Application Log.
Note
If you have built a cluster system in the following environments, these logs cannot be displayed from Cluster Admin.
FUJITSU Cloud Service K5 environment
Environment that uses Firewall
Display all RMS log files (/var/opt/SMAWRrms/log/) using a common UNIX text editor such as vi.