The Cluster Foundation is the base on which all the other modules are built. It provides the fundamental services, such as the OSD, that all other PRIMECLUSTER components use as well as the base cluster services.
CF has the following features:
Contains a loadable pseudo device driver that automatically loads when the system starts
Supplies the CF driver that contains the CF kernel-level OSD and generic modules
Some of the functions that CF provides are detailed in the sections that follow.
The CF operating-system-dependant (OSD) module provides an interface between the native OS and the abstract, OS-independent interface upon which all PRIMECLUSTER modules depend. This allows PRIMECLUSTER to use the same source files for all supported operating systems and architectures. The two main advantages of this design are as follows:
Only need to maintain one version of the source
Simplifies the porting of CF to a new operating system or architecture
The Internode Communication Facility (ICF) module is the network transport layer for all PRIMECLUSTER inter-node communications. It provides the following functions:
Ordered, guaranteed, node-to-node datagram communication services
Guarantees to deliver messages to the destination node in the queued for transmission order, unless the destination node fails
Interfaces via OS-dependent code to the Network I/O sub-system
To avoid a single point of hardware failure, ICF supports multiple interconnects. When multiple interconnects are available, ICF spreads messages across all available interconnects to improve performance. ICF automatically switches between interconnects when a failure occurs. ICF has a route recovery mechanism for transient interconnect failures such as a network switch being powered off and on again.
ICF is only usable by the CF internal components and is not available to user-level resources. To provide applications with an access to the cluster interconnect, Cluster Interconnect Protocol (CIP) is used. CIP provides a standard TCP/IP protocol suite over ICF.
The cluster join services module (JOIN) dynamically joins a node to a cluster. If the cluster does not exist, then CF creates it. It is possible for several nodes to simultaneously try to form a cluster. The mastering algorithm solves this problem by using a distributed-election algorithm to determine which node should become master and form the cluster. Each node has equal rank, and each node can form the initial one-node cluster.
After the initial cluster is formed, all other nodes can join it. JOIN has built-in support for rolling upgrades by providing versioning information during the initial mastering phase. A new node joining the cluster automatically selects the protocol version in use by the current cluster.
The Event Notification Services (ENS) module provides an atomic-broadcast facility for events. Messages queued to ENS are guaranteed to either be delivered to all of the nodes or to none of the nodes. PRIMECLUSTER modules and application programs can both use ENS. Applications can register with ENS to receive notification of cluster events such as nodes joining or leaving the cluster. Applications can also define and broadcast application-specific events to other applications that register for it.
The Cluster Admin manager is an administrative interface for the following cluster features:
Administration can be done from any node in the cluster, remotely from the Internet, or from both. A Java-enabled Web browser serves as the administrative interface; a conventional command-line interface is also available on a node. Diverse, clear-reporting metrics and event logs provide concise and timely information on the state of the cluster.
Web-Based Admin View is a GUI framework used by the PRIMECLUSTER products. The features of Web-Based Admin View are as follows:
Common framework for multiple GUIs
In addition to the Cluster Admin GUI, which controls CF, RMS, and SF, PRIMECLUSTER contains GUIs for other services such as GDS and GFS. In the Web-Based Admin View, all of these GUIs operate as a common framework.
A single login for multiple GUIs.
Password encryption. Passwords sent from the client browser to the management server are encrypted.
Logging of all GUI commands dealing with configuration or administration.
The ability to off load the management overhead onto the management servers outside the cluster.
See
For additional information about Web-Based Admin View features, see "PRIMECLUSTER Web-Based Admin View Operation Guide."
The PRIMECLUSTER Shutdown Facility (SF) provides an interface to guarantee machine shutdown during error processing within the cluster. PRIMECLUSTER SF is made up of the following major components:
Shutdown Daemon (SD)
The SD monitors the state of cluster machines and provides an interface for gathering status and requesting manual machine shutdown.
One or more Shutdown Agents (SA)
The SA's role is to guarantee the shutdown of a remote cluster node.
MA (asynchronous monitoring)
In addition to the SA, the MA monitors the state of remote cluster nodes and immediately detects failures in those nodes.
The advantages of PRIMECLUSTER Shutdown Facility are as follows:
Ability to shut down a cluster node with or without running RMS
Ability to shut down a cluster node from any PRIMECLUSTER service-layer product
Redundant shutdown methods are available
Ability to periodically (every ten minutes) check a route that shuts down a cluster node
The Monitoring Agent (MA) has the capability to monitor the state of a system and promptly detect a failure such as system panic and shutdown. This function is provided by taking advantage of the hardware features that detect the state transition and inform the upper-level modules.
Without the MA, the cluster heartbeat time-out detects only a communication failure during periodic intervals. The MA allows the PRIMECLUSTER system to quickly detect a node failure.
The MA provides the following functions:
Monitoring a node state
The MA monitors the state of the remote node that uses the hardware features. It also notifies the Shutdown Facility (SF) of a failure in the event of an unexpected system panic and shutoff. Even when a request of responding to heartbeat is temporarily disconnected between cluster nodes because of an overloaded system, the MA recognizes the correct node state.
Forcibly shutting down a failure node
The MA provides a function to forcibly shut down the node as Shutdown Agent (SA).
Checking a connection with the optional hardware (Shutdown Agent testing)
The MA provides a function as the SA (Shutdown Agent). It periodically (every ten minutes) checks the proper connection with the optional hardware that monitors a node state or shuts down a node.
PRIMECLUSTER SF provides the following Monitoring Agents:
The MA monitors the node state and detects a node failure by using the SCF/RCI mounted on SPARC Enterprise M-series. The System Control Facility (SCF), which is implemented on a hardware platform, monitors the hardware state and notifies the upper-level modules. The MA assures node elimination and prevents access to the shared disk.
Note
Node state monitoring of the RCI asynchronous monitoring function operates from when message (a) shown below is output until message (b) is output.
The messages for the console asynchronous monitoring function are messages (c) and (d).
The messages for the SNMP asynchronous monitoring function are messages (e) and (f).
The messages for the MMB asynchronous monitoring function are messages (g) and (h).
When node state monitoring is disabled, the function that forcibly stops nodes may not operate normally.
(a) FJSVcluster:INFO:DEV:3042: The RCI monitoring agent has been started.
(b) FJSVcluster:INFO:DEV:3043: The RCI monitoring agent has been stopped.
(c) FJSVcluster:INFO:DEV:3040: The console monitoring agent has been started (node:monitored node name).(d) FJSVcluster:INFO:DEV:3041: The console monitoring agent has been stopped (node:monitored node name).(e) FJSVcluster:INFO:DEV:3110: The SNMP monitoring agent has been started.
(f) FJSVcluster:INFO:DEV:3111: The SNMP monitoring agent has been stopped.
(g) FJSVcluster:INFO:DEV:3080: The MMB monitoring agent has been started.
(h) FJSVcluster:INFO:DEV:3081: The MMB monitoring agent has been stopped.
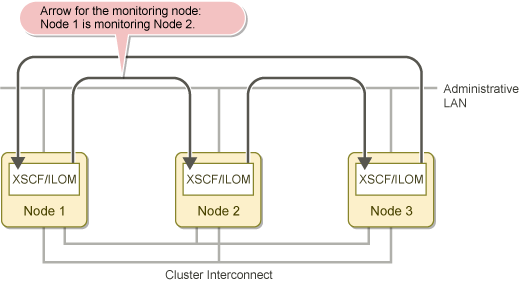
The console monitoring agent monitors message output to the console of each node. If an error message of a node failure is output to one node, the other node detects the message and notifies SF of a node failure. Normally, the console monitoring agent creates a loop, monitoring another node, for example, A controls B, B controls C, and C controls A. If one node goes down because of a failure, another node takes over the monitoring role instead of this failed node.
The console monitoring agent also ensures node elimination by sending a break signal to the failed node.
The figure below shows how the monitoring feature is taken over in a cluster system with three nodes if one node goes down. The arrow indicates that a node monitors another node.
Figure 2.3 MA normal operation
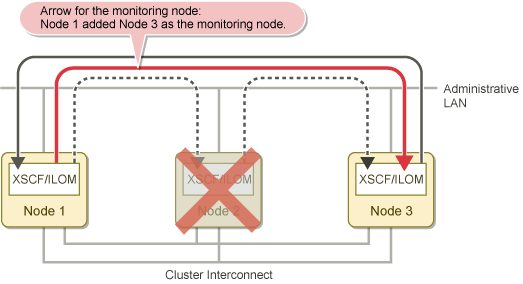
When a failure occurs, and Node 2 is DOWN, the following actions occur:
Node 1 begins to monitor Node 3.
The following message is output to the /var/adm/messages file of Node 1:
FJSVcluster:Information:DEV:3044: The console monitoring agent took over monitoring (node: targetnode)The figure below shows how Node 1 added Node 3 as the monitored node when Node 2 went down.
Figure 2.4 MA operation in the event of node failure
Note
If monitoring function is taken over while the console monitoring agent is stopped, the stopped console monitoring agent is resumed.
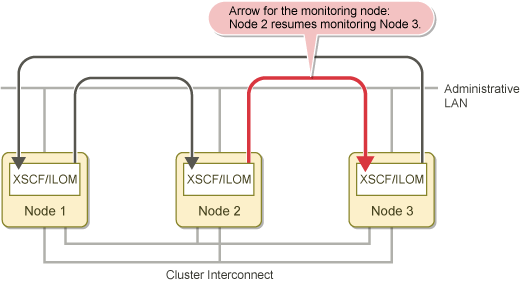
When Node 2 recovers from the failure and starts, the following actions occur:
The original monitoring mode is restored.
The following message is output to the /var/adm/messages file of Node 1:
FJSVcluster:Information:DEV:3045: The console monitoring agent cancelled to monitor (node: targetnode)The figure below shows how Node 2 returns to monitoring Node 3 once it has been restored to the cluster.
Figure 2.5 Node recovery
The following are possible messages that might be found in the /var/adm/messages file:
FJSVcluster:Information:DEV:3042: The RCI monitoring agent has been started
Indicates that the RCI monitoring agent is enabled.
FJSVcluster:Information:DEV:3043: The RCI monitoring agent has been stopped
Indicates that the monitoring feature is disabled.
FJSVcluster:Information:DEV:3040: The console monitoring agent has been started (node:monitored node name)
Indicates that the monitoring feature of the console monitoring agent is enabled.
FJSVcluster:Information:DEV:3041: The console monitoring agent has been stopped (node:monitored node name)
Indicates that the monitoring feature of the console monitoring agent is disabled. When the monitoring feature is not enabled, the other feature that forcibly brings the node DOWN might not work.
Note
The console monitoring agent monitors the console message of the remote node. So it cannot recognize the node state in the event of an unexpected shutdown. In such a case, the node goes into the LEFTCLUSTER state, and you need to mark the remote node DOWN. For how to mark a node with DOWN, see "PRIMECLUSTER Cluster Foundation (CF) Configuration and Administration Guide."
This function monitors the node state by using the eXtended System Control Facility (XSCF) installed in the SPARC M-series.
The function can ascertain node failures by having the XSCF report the node state to the software.
This function can intentionally trigger a panic or a reset in other nodes to forcibly stop those nodes with certainty and prevent contention over user resources.
This function uses the MMB, which is one of the hardware units installed in PRIMEQUEST, to monitor nodes. The function can ascertain node failures by having the MMB, which is one of the standard units installed in the hardware, report the node state to the software.
This function can intentionally trigger a panic or a reset in other nodes to forcibly stop those nodes with certainty and prevent contention over user resources.
Note
If a node error occurs while an MMB error has occurred, it may take longer than usual for the node failure to be ascertained (up to 6 seconds).
If a node error occurs while an error has occurred in one of the MMB management LAN systems in all the nodes, it may take longer than usual for the node failure to be ascertained (up to 6 seconds).
It may take up to 20 minutes for an MMB error to be detected.
If the MMB is recovered from an error, it takes up to 10 minutes for that recovery to be detected. However, if a node error occurs before the recovery is detected, the recovery is recognized at that point, and the MMB asynchronous function actually operates without any problems. To have an MMB recovery detected immediately after the MMB is recovered from an error, restart the Shutdown Facility (SF).
If an error (snmptrapd is stopped) occurs in the local node, the following message is displayed:
FJSVcluster:INFO:DEV:3084:Monitoring another node has been stopped.
In this case, node state monitoring is disabled. Therefore if a node error occurs under this condition, it may take longer than usual for the node failure to be ascertained.
Also after a node is started or after the Shutdown Facility is restarted, node state monitoring is disabled even if the following message is not displayed. Therefore if a node error occurs under this condition, it may take longer than usual for the node failure to be ascertained.
FJSVcluster:INFO:DEV:3083:Monitoring another node has been started.
The following message may be displayed while a node is being started:
FJSVcluster: INFO: DEV: 3084: Monitoring another node has been stopped.
This condition occurs because snmptrapd is being started, and there is no problem as long as the following message is output within about 10 minutes after snmptrapd is started:
FJSVcluster: INFO: DEV: 3083: Monitoring another node has been started.
If you execute sdtool -s immediately after the node is started, Test Failed may be displayed as the test state of the local node. To check the test state of the local node immediately after the node is started, execute sdtool -r and then execute sdtool -s.
The MMB asynchronous monitoring function displays the following messages if the MMB management LAN is disconnected:
FJSVcluster:WARN:DEV:5021:An error has been detected in part of the transmissionroute to MMB. (node:nodename mmb_ipaddress1:mmb_ipaddress1 mmb_ipaddress2:mmb_ipaddress2 node_ipaddress1:node_ipaddress1 node_ipaddress2:node_ipaddress2)
FJSVcluster:ERROR:DEV:7213:An error has been detected in the transmission route to MMB. (node:nodename mmb_ipaddress1:mmb_ipaddress1 mmb_ipaddress2:mmb_ipaddress2 node_ipaddress1:node_ipaddress1 node_ipaddress2:node_ipaddress2)
Respond according to the action for each message. If error message 7213 is displayed, node state monitoring is disabled. Therefore the function that forcibly stops other nodes may not operate normally.
In addition, if an error (for example, snmptrapd terminates abnormally) occurs in the local node, the following message is displayed:
FJSVcluster:ERROR:DEV:7210:An error was detected in MMB. (node:nodename mmb_ipaddress1:mmb_ipaddress1 mmb_ipaddress2:mmb_ipaddress2 node_ipaddress1:node_ipaddress1 node_ipaddress2:node_ipaddress2 status:status detail:detail)
In this case as well, node state monitoring is disabled. Therefore the function that forcibly stops other nodes may not operate normally.
For details on this message, see "PRIMECLUSTER Messages."
The SA guarantees to shut down a remote cluster node. The SA may vary depending on the architecture of each cluster node.
The SA provides the following functions:
Forcibly shutting down a failure node
The SA guarantees to shut down a failure node.
Checking a connection with the optional hardware (Shutdown Agent testing)
The SA periodically (every ten minutes) checks the proper connection with the optional hardware that shuts down a node.
The PRIMECLUSTER Shutdown Facility provides the following Shutdown Agents:
RCI (SA_pprcip, SA_pprcir): Remote Cabinet Interface
This SA uses the RCI, which is one of the hardware units installed in SPARC Enterprise M-series, to stop other nodes with certainty by intentionally triggering a panic or reset in those nodes.
XSCF (SA_xscfp, SA_xscfr, SA_rccu, SA_rccux): eXtended System Control Facility
The SA uses the XSCF, which is one of the hardware units installed in SPARC Enterprise M-series, to stop other nodes with certainty by intentionally triggering a panic or reset in those nodes.
If the XSCF is being used in the console, the Shutdown Facility stops other nodes with certainty by sending the break signal to those nodes.
ALOM (SA_sunF): Advanced Lights Out Management
The SA uses ALOM of SPARC Enterprise T1000, T2000 to stop other nodes with certainty by sending the break signal to those nodes.
ILOM (SA_ilomp, SA_ilomr): Integrated Lights Out Manager
The SA uses ILOM of SPARC Enterprise T5120, T5220, T5140, T5240, T5440, SPARC T3, T4, T5, T7, S7 series to stop other nodes with certainty by intentionally triggering a panic or reset in those nodes.
KZONE (SA_kzonep, SA_kzoner, SA_kzchkhost)
Oracle Solaris Kernel Zones
If Oracle Solaris Kernel Zones are used with SPARC M10 and SPARC T4, T5, T7, S7 series, the node can be completely stopped by intentionally panicking or resetting another node (Kernel Zone).
The status of the global zone host is also checked so that when the global zone host is stopped, another node (Kernel Zone) is determined to be stopped. The global zone host is not forcibly stopped.
RPDU (SA_rpdu)
Remote Power Distribution Unit
When using the Remote Power Distribution Unit with SPARC M10-1, M10-4, SPARC Enterprise M3000, M4000, and M5000, the node can be completely stopped by power-off of the main power and the redundant power.
NPS (SA_wtinps): Network Power Switch (not supported)
The SA uses the Western Telematic Inc.'s Network Power Switch (WTINPS) to stop other nodes with certainty by shutting them down.
BLADE (SA_blade)
This SA, which can be used in the PRIMERGY blade server, uses the SNMP command to stop other nodes with certainty by shutting them down.
IPMI (SA_ipmi): Intelligent Platform Management Interface
This SA uses the IPMI, which is one of the hardware units installed in PRIMERGY, to stop other nodes with certainty by shutting them down.
kdump (SA_lkcd)
The SA uses kdump in PRIMERGY or the PRIMERGY blade server to stop other nodes with certainty by intentionally triggering a panic.
MMB (SA_mmbp, SA_mmbr): Management Board
This SA uses the MMB, which is one of the hardware units installed in PRIMEQUEST, to forcibly stop other nodes with certainty by intentionally triggering a panic or reset in those nodes.
ICMP (SA_icmp)
The SA uses the network path to check other nodes. If no response is received from other nodes, the SA determines that nodes are shut down.
Other nodes are not forcibly shut down.
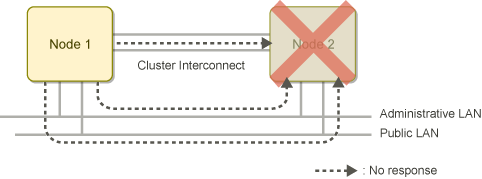
The figure below shows an example of state confirmation by SA_icmp if one node (Node 2) goes down in a cluster system with two nodes.
If no response is received from Node 2 through all specified network paths, SA_icmp determines that Node 2 is shut down.
Figure 2.6 State confirmation by SA_icmp if the other node goes down
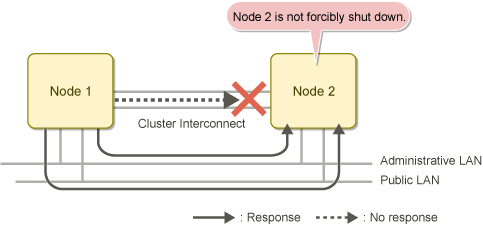
The figure below shows an example of state confirmation by SA_icmp if the cluster interconnect fails in a cluster system with two nodes.
If Node 1 receives a response from Node 2 on any of specified network path, SA_icmp determines that Node 2 is running.
In this case, Node 2 is not forcibly shut down by SA_icmp.
Figure 2.7 State confirmation by SA_icmp if the cluster interconnect fails
VMCHKHOST (SA_vmchkhost)
When the cluster system is installed in the host OS with the KVM machine, the SA checks the status of guest OSes together with the cluster system of the host OS.
Other nodes are not forcibly shut down.
libvirt (SA_libvirtgp, SA_libvirtgr)
When using a KVM virtual machine in PRIMERGY, the PRIMERGY blade server, and PRIMEQUEST 1000/2000 series, the SA stops other nodes with certainty by intentionally triggering a panic or reset in those nodes.