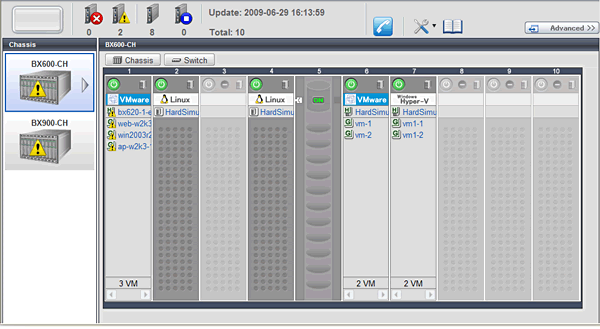
This section provides a functional overview of BladeViewer.
BladeViewer provides an intuitive representation of blade servers and their statuses. This makes it easier to monitor resource states or perform basic operations on blade servers.
Figure 4.1 BladeViewer

BladeViewer allows the following operations:
Monitoring of resource statuses
The statuses of chassis, servers, L2 switches, and physical OSs can be monitored from a view representative of the actual placement and configuration of physical devices.
When using virtual servers, BladeViewer shows a list of VM guests for each VM host. This helps keeping track of relationships between VM guests and VM hosts.
BladeViewer also makes it easy to confirm which operating systems (physical OS and guest OS) are affected by a hardware failure.
Display and control of power status
The power status of each server blade, storage blade, and VM guest is represented by an intuitive power button.
Clicking this button provides quick access to power control operations (for both server blades and VM guests).
Display of custom labels and comments
BladeViewer allows users to define custom labels and comments for each physical OS, VM host, and VM guest.
Once defined, labels are shown on top of each displayed physical OS, VM host, and VM guest. Using labels to display application contents makes it easy to visualize what applications are running on each server blade and identify the applications affected by a server failure.
Clicking on a label displays the comment defined for the related resource. Registering troubleshooting and recovery procedures beforehand can speed up the recovery of affected applications when a problem occurs.
Display of contact information
BladeViewer allows users to define technical (support) contact information for their entire IT system. This contact information can be shown by clicking on the Contact icon.
Registering contact details of technical support staff beforehand can help streamline recovery procedures when problems occur.