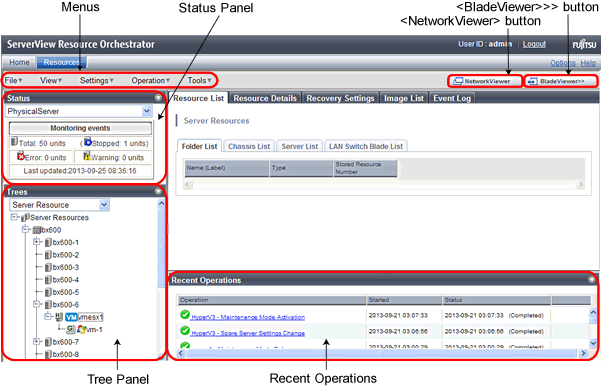
This section explains how the [Resource] tab of the ROR console is organized.
The [Resource] tab of the ROR console is sometimes referred to as the ROR console.
Figure A.1 ROR Console

Operations can be performed either from the menu bar or popup menus.
The Status Panel displays the status of managed servers.
If a warning or error event occurs on a managed server, the status monitoring area starts to blink.
By switching between tree types, it is possible to select from the following four types of trees.
The resources below are shown in a tree view. A status icon is displayed over each resource's icon.
Chassis
Server
Physical OS
VM Host
VM guest
LAN Switch
The resources below are shown in a tree view. A status icon is displayed over each resource's icon.
LAN switch (excluding LAN switch blades)
The following power monitoring devices are shown in a tree view.
PDU
UPS
The following management software, which can be used in coordination with Resource Orchestrator, are shown in a tree view. A status icon is displayed over each resource's icon.
Management Software (vCenter Server)
Management Software (SCVMM)
Management Software (VIOM)
The Main Panel displays information on resources selected in the tree.
[Resource List] Tab
Displays information on resources related to the resource selected in the resource tree.
[Resource Details] Tab
Displays more detailed information on the resource selected in the tree, or a resource that was double-clicked in the [Resource List] tab.
[Recovery Settings] Tab
Displays information on the spare servers assigned to the resource selected in the resource tree.
[Image List] Tab
Displays system and cloning image information.
Event
Resource Orchestrator events and related information are displayed.
The event log displays a history of events that have occurred on managed resources.
Displays the progress statuses and results of operations performed in Resource Orchestrator.
Displays the NetworkViewer showing the network configuration in another window or tab.
The browser settings determine whether another window or tab is used.
For details, refer to "13.2 Screen Layout".
Opens the BladeViewer interface.
BladeViewer is a management interface specially designed for blade servers. It can only be used in conjunction with PRIMERGY BX servers registered as managed servers.
For details, refer to "6.2 User Interface".