This section explains how to confirm usage charges from the organization viewpoint.
Go to the [Refer to Billing] menu in the [Home] window and click the [By Organization] link, or click the [Billing] navigation tab.
The [Billing] window is displayed with the accumulated charges calculated for each organization.
Figure 6.1 Billing Window (By Organization)
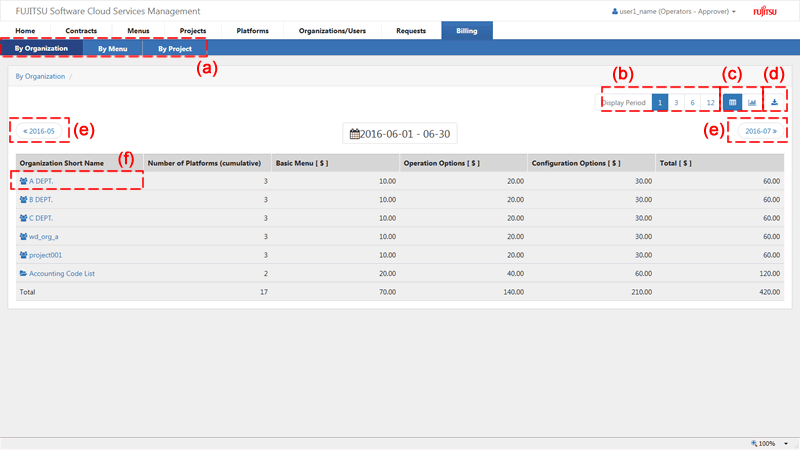
Switch View
Switches the unit of display of charges between organizations, menus, and projects.
Display Period
Switches between different display periods: monthly, quarterly, semi-annual, and annual. When displaying multiple months, the starting month will vary depending on the system information value specified in the "FUJITSU Software Cloud Services Management Operation Guide".
Toggle List/Graph
Toggles the view between list and graph displays. The amounts in the graph display indicate total charges.
Download CSV
Displayed charges can be downloaded in CSV format.
Note
When [Internet Explorer's Enhanced Security Configuration] is enabled in a Windows Sever environment, it may not be possible to download files using Internet Explorer.
Changes between the previous period and the next period.
Change the Level of the Organization/Accounting Code
Clicking this changes the unit of display to the organizations belonging to the selected organization. Drilling down switches the view to a list of the accounting codes linked to the organization. In addition, selecting an accounting code switches the view to a list of the projects linked to the selected accounting code. Selecting a project switches the view to a list of the platforms in the project. Selecting a platform displays the [Billing Details] window at the level of individual platforms.
Figure 6.2 Billing Window (By Accounting Code)
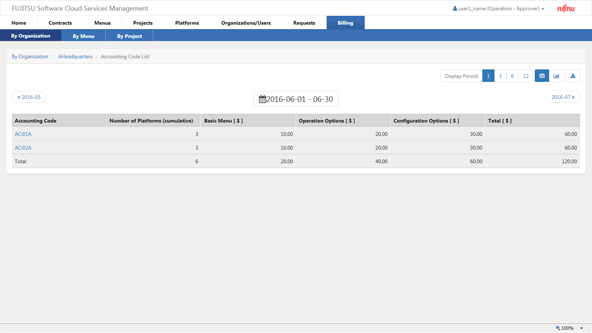
Figure 6.3 Billing Window (By Project)
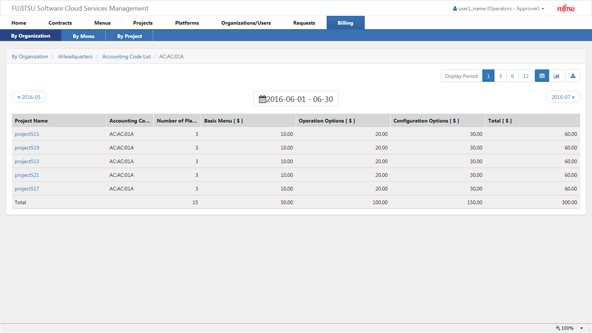
Figure 6.4 Billing Window (By Platform)
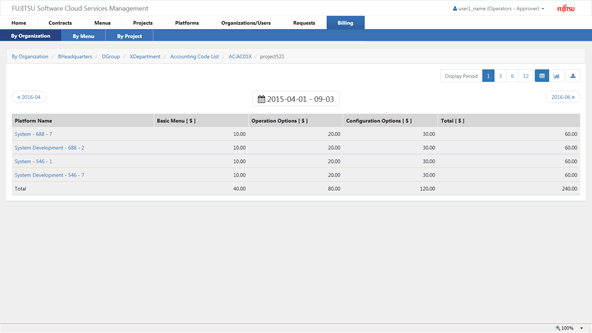
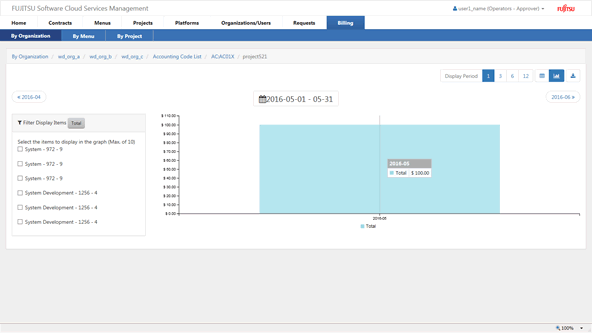
Figure 6.5 Billing Window by Organization: Graph Display
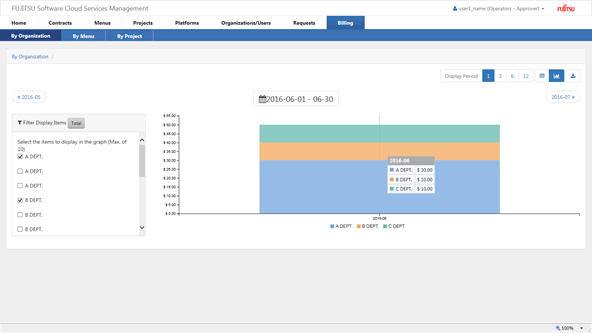
Point
The display of data and data titles varies depending on the number of pieces of data in the display period.
If the number of pieces of data is 10 or smaller: a breakdown of the data is displayed as a tooltip when the mouse pointer hovers over the graph.
If the number of pieces of data is 11 or larger: the total number of pieces of data is displayed in a tooltip when the mouse pointer hovers over the graph.
By selecting an item to be displayed in the [Filter Display Items] field, the data to be displayed can be filtered. Up to 10 items to be displayed can be selected.
