To debug applications in which Visual Basic programs call COBOL programs, the COBOL debugger is started first. You tell the debugger where the COBOL source and debugging information is stored then, instead of loading a COBOL program into the debugger, you specify Visual Basic as the application. Within Visual Basic you execute or debug the VB programs as normal and when Calls to COBOL are executed the COBOL debugger gains control so that you can debug the COBOL programs. This process is detailed in the following instructions.
Once you have the COBOL programs compiled, linked and stored in a suitable folder, start the COBOL debugger. It can be started from within Programming Staff or from the Windows desktop.
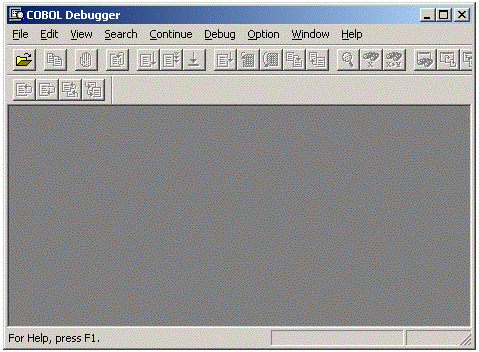
The debugger displays a blank debug window.
Figure 4.1 COBOL Debugger Main Window
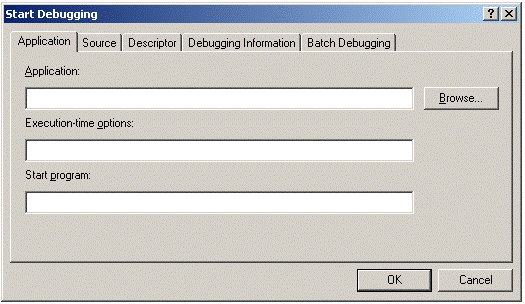
Select File, Start Debugging from the menu. The Start Debugging dialog box is displayed.
Figure 4.2 The Start Debugging Menu
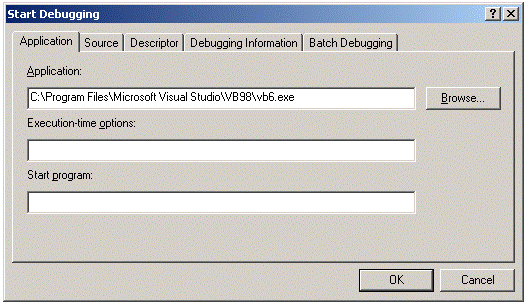
Enter, or browse for, the location of the Visual Basic program.
Figure 4.3 Application Field Filled In
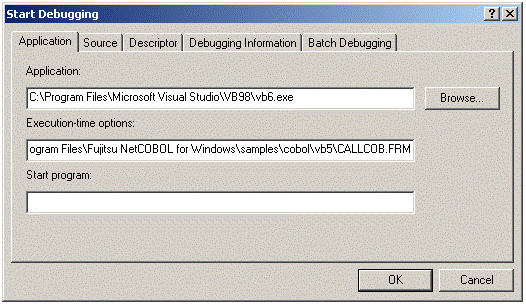
Enter the name of the Visual Basic program you wish to start in the Execution-time-option edit box. Alternatively, you can leave this field blank and load the program after Visual Basic starts.
Figure 4.4 CallCOB.frm as Execution-time option
Click on the Source tab. Enter, or browse for, the name of the folder containing your COBOL source. If your programs use source libraries and subschemas, also enter these folder names.
Figure 4.5 Filling in Source File Storage Folders

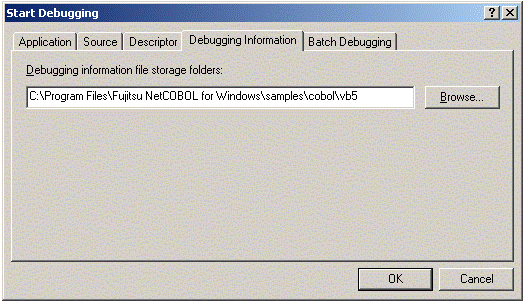
Click on the Debugging Information tab. Enter, or browse for, the name of the folder containing the debugging information for the COBOL programs. The debugging information is stored in the folder specified in the TEST compiler option, or the folder containing the COBOL source if no folder is specified in the TEST option.
Figure 4.6 Debugging Information Entered
You are now ready to start debugging. Click on OK to invoke Visual Basic.
In Visual Basic start executing or debugging your Visual Basic program. The snapshot below shows a simple Visual Basic program that calls a COBOL program called COBDLL.
Figure 4.7 The Visual Basic Debugger
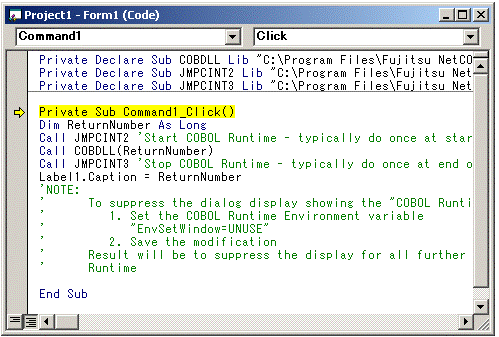
Step through the Call to JMPCINT2 which initializes the COBOL runtime system. Typically this is executed once at the beginning of the VB application.
Step into the Call to the COBOL program.
On the first Call, it will appear that nothing is happening. You need to switch to the COBOL debugger window (this is titled "VB6 - COBOL Debugger"). On subsequent Calls to COBOL the COBOL debugger window is displayed automatically.
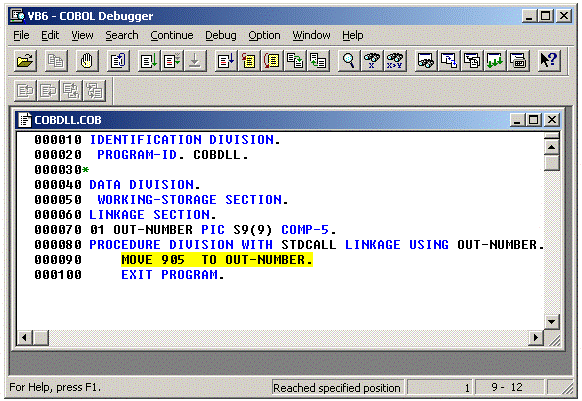
The Called source is displayed.
Figure 4.8 The COBOL Debugger
Note
Sometimes a tool tip from the Visual Basic debug toolbar may remain visible on top of the COBOL debugger window. It does not affect the execution of the COBOL code or debugger.
Debug the COBOL code as normal.
Note
a) The accelerator key for Step Into is F8 in both Visual Basic and the COBOL debugger.
b) Remember to set breakpoints in the COBOL program before a Go or Run command, as you may not be able to regain control in the COBOL source.
When you execute an EXIT PROGRAM statement in the top level COBOL program, control is returned to Visual Basic.
Continue debugging in Visual Basic and COBOL until you are ready to stop. Be sure to follow the instructions in the section "Stopping Debugging with COBOL and Visual Basic" when stopping debugging.