The structure of Information disclosure analysis report is as follows:
Classification | Sheet Name | Description |
|---|---|---|
Summary Sheet | Summary | Summary of the generated report is recorded. |
Detail Sheet | Detail (File export) | All kinds of aggregation information (ranking information) of each operation log is recorded. |
Detail (File Operation) | ||
Detail (Times of Printing Operation) | ||
Detail (Pages of Printing Operation) | ||
Detail (E-mail Sending Log by Recipient Address) | ||
Details (FTP operation uploads) | ||
Details (Web operation uploads) | ||
Object Group Sheet | Object Group | The list of departments that has collected analysis target logs is recorded. |
The layouts of the generated report file and printing result may vary depending on the version of Microsoft(R) Excel and service pack being used.
Summary Sheet

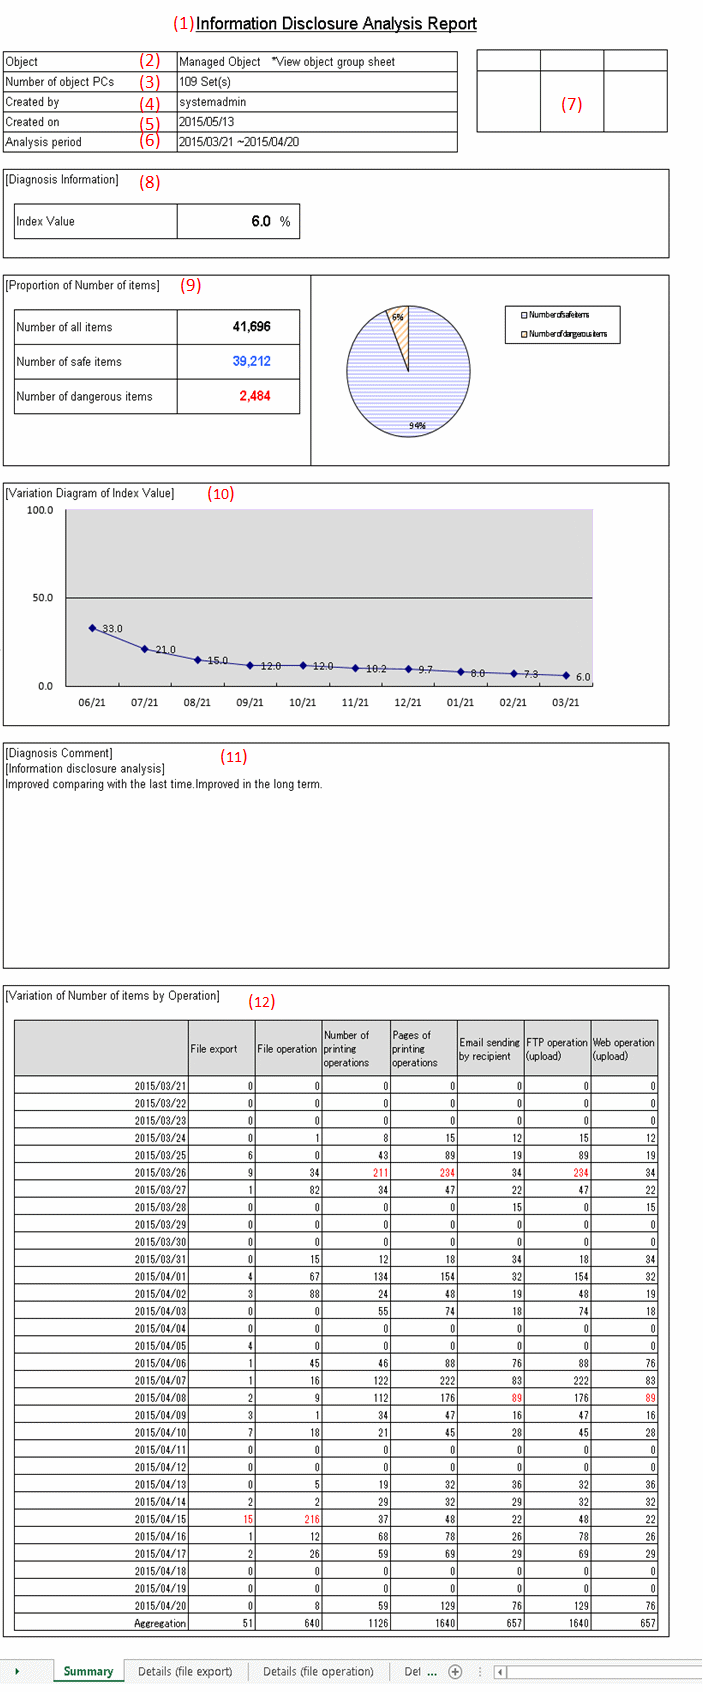
The title specified in the basic information settings is recorded.
Display the managed target. It is always displayed as "Managed Target".
Display the number of all PCs of managed target.
When the target PC does not exist, 0 will be displayed.
The creator name specified in the basic information settings is recorded.
The date of report output is recorded.
The analysis period specified in the basic information settings is recorded.
It is the approval column (The number of columns cannot be modified) when it is used as a report.
The proportion of dangerous cases (Refer to "Number of Dangerous Cases" of "(9) Proportion") in all operations is indicated in percentage.
Number of all items
The following section varies depending on the analysis content.
[Information Disclosure Analysis]
Number of file export cases (number of cases exported to a removable device or DVD/CD) + number of file operation cases (number of cases copied or moved to DVD/CD, or created and viewed in a removable device or DVD/CD) + number of printing operation cases + number of cases of E-mail sending Log by recipient address (number of cases of E-mail sending log by recipient address that does not match the screening condition) + number of FTP operations (upload) + number of Web operations (upload)
[Terminal Usage Analysis]
Number of cases of Window title obtaining with URL +number of cases of E-mail sending log by recipient address + number of cases of application startup
[Violation Operation]
Number of all cases of information disclosure + number of all cases of terminal usage + number of dangerous cases of violation operations
Number of safe items
Total number of operation cases excluding the dangerous ones.
Number of dangerous items
The following section varies depending on the analysis content:
[Information disclosure analysis]
Number of cases in all cases that match the screening condition (keywords).
[Terminal usage analysis]
Number of cases of Window title obtaining with URL that does not match the screening condition (domain) +number of cases of E-mail sending log by recipient address that does not match the screening condition (domain) + number of cases of application startup that does not match the screening condition (application)
[Violation Operation Analysis]
Number of application startup prohibition cases + number of printing prohibition cases + number of logon prohibition cases+ number of PrintScreen key prohibition cases + number of E-mail file attachment prohibition cases
Pie chart
The pie chart can be used to display the proportion of safe cases to dangerous cases.
When the number of cases is 0, the pie chart will not be displayed. "1%" will be displayed in the location of the pie chart.
The variation of the index value is displayed by curve graph (the last 10 times).
The vertical axis of the chart is the numerical value of the index value. The bottom end indicates the dangerous rate to be 0 while the top end indicates the dangerous rate to be 100. Therefore, the closer to zero the index value is, the more ideal the state is.
The horizontal axis shows the start day of each analysis period. On the horizontal axis, the index value of analysis period without data is 100.
Inspection of comparison with the last time
Through the difference value of the index value obtained by comparing the result with the previous diagnosis, information on whether the danger level has increased or decreased can be obtained. Based on this, comment about risk status judgment can be proposed for the index value of this analysis result.
Long-term tendency
According to the increased or decreased index value compared to the past, comment about risk status judgment can be proposed for the index value predicted based on the variation of the index value from the past analysis result.
Inspection about day/operation that requires attention
The date and operation with the highest risk in the period that requires investigation will be prompted. (Only when monthly report or weekly report is selected)
The variation of the number of each operation item set in the analysis period is displayed in table format.
The analysis period is one month for a monthly report, 7 days for a weekly report, and one day for a daily report.
In addition, the maximum number of operation cases within the period is displayed in red character in each operation log.
Detail Sheet
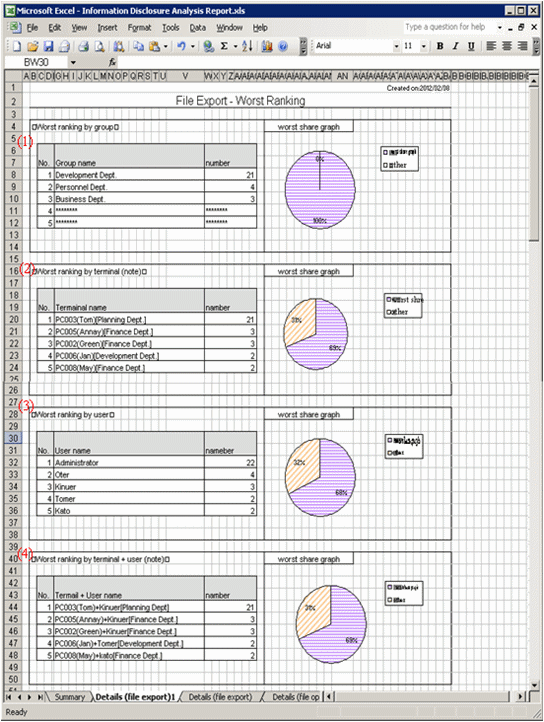
The information output to the detail sheet is described using "Detail (File Export) Sheet" as an example.
The other operations such as file access are output in the same format.
Up to 512 halfwidth characters (256 fullwidth characters) can be displayed in the contents of each item in ranking table.

When the same ranking exists and the displayed data amount exceeds the set value of ranking number, up to 30 cases can be displayed.
Display the aggregation result by group with the ranking in descending sequence of number of cases. In addition, the proportion of number of operation cases performed by groups in top ranking to all operations will be show in the ranking share graph.
Display the aggregation result by terminal with the ranking in descending sequence of number of cases. At the same time, the graph will also be displayed, and the proportion of number of operation cases performed by terminals in top ranking to all operations will be shown in the ranking share graph.
Display the aggregation result by user with the ranking in descending sequence of number of cases. At the same time, the graph will also be displayed, and the Proportion of number of operation cases performed by users in top ranking to all operations will be shown in the ranking share graph.
Display the aggregation result by terminal + user with the ranking in descending sequence of number of cases. At the same time, the graph will also be displayed, and the Proportion of number of operation cases performed by terminals corresponding to the users in top ranking to all operations will be shown in the ranking share graph.
Note: "Computer Name" and "Computer Name + User Name" of ranking cases are displayed in the following format.
When Name displayed in the CT list of the Management Console is the same as Computer Name
The following are conditions that make Name and Computer Name the same:
Because Name is not updated after CT installation, the initial value will be displayed as Computer Name.
The Name is updated to the same name as Computer Name in the Management Console.
At this time, it will be displayed in the format of "Computer Name [Group Name]" in ranking by terminal.
[Example] PC001 [Personnel Department]
In ranking by terminal + user name, it will be displayed in the format of "Computer Name + User Name [Group Name".
[Example] PC001 + Administrator [Personnel Department]
When the Name displayed in the CT list of the Management Console is different from Computer Name
The following are conditions that make Name and Computer Name different:
The Name is updated to a different name from Computer Name in the Management Console.
At this time, it can be displayed in the format of "Computer Name (Name) [Group Name]" in ranking by terminal.
[Example] BLONO (Fujitsu Taro) [Personnel Department]
In ranking by terminal + user, it can be displayed in the format of "Computer Name (Name) + User Name [Group Name]".
[Example] BLONO (Fujitsu Taro) + Administrator [Personnel Department]
Object Group Sheet
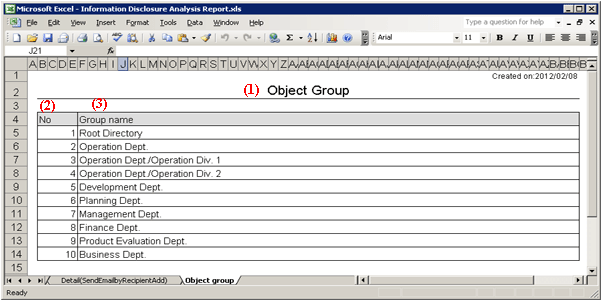
The department information that has been analyzed will be output.

This is recorded as "Object Group".
The department of analysis target is recorded.
The group name can be recorded with the full path beginning from the root.
[Example] Development Department/ Development Unit 3
When multiple managed departments exist, they can be displayed after adding rows.
Up to 50,000 departments can be recorded.
Up to 512 halfwidth characters (256 fullwidth characters) can be displayed in the content of each item in object group.