The following explains a typical analysis window configuration, name (abbreviated name) of each part and contents. For details of the operations, refer to the following explanations and online help.
After data is analyzed, an analysis page like the one below is displayed.
The initial window following startup is a summary window. No graph is displayed.
In this section, explanation is given with the analysis page by client host name of the request situation as a sample.
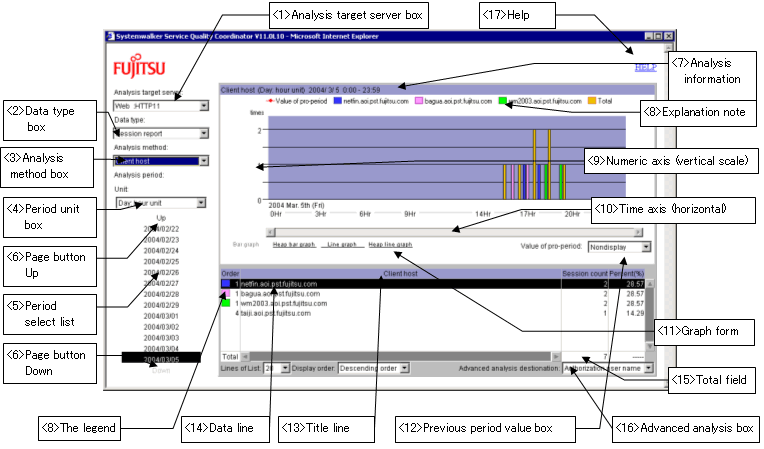
Description of the analysis window
Analysis target server box
Select the server to be analyzed. If you select a server from the drop-down list, a data analysis is carried out and the "summary window" is displayed.
At this point, a drop-down list of the data type corresponding to the selected server type (Web server, Proxy server or Web Site group) is also provided in the data type box.
The server name displayed in this box is the name specified in the Name operand of the "15.2.1 Usage DB Environment Definition File" of the "15.2.1.4 File internal format (analysis target server definition block)". Note that if the name is too long, the first part of the name is displayed.
Data type box
Select the type of analysis data required.
Analysis method box
From the drop-down list, select the required analysis method, to have data of the type selected in <2> analyzed from that point of view.
The content of the analysis page that is displayed depends on the selected analysis data type and analysis method. For further information, refer to "11.2.5 Analysis window options".
Period unit box
Select the period unit for analysis.
When you select the period unit for data analysis from the drop-down list, the display of "5. Period selection list" changes according to the selected unit.
Selecting the period unit for data analysis does not start data analysis.
Period selection list
Select the interval for which data is to be analyzed.
Up and Down buttons
To scroll the period list use these buttons:
Up - to view earlier periods, click this button at the top of the list
Down - to view later periods, click this button at the bottom of the list.
Analysis information
The following information about the analysis results is displayed:
This part is intended for display only and no operation can be performed.
Information | Explanation |
|---|---|
Analysis period | The period selected in the period selection list is displayed. |
Extraction name/graph display target name | Only for the following analysis pages, the following contents are displayed below the analysis type name respectively: Advanced analysis page: Displays the extraction names. Response analysis page: Displays graph display target names. The extraction name is a name selected from a line of a table during advanced analysis. For details, refer to "Carrying out advanced analysis" in "11.2.6.1 Performing data analysis". The graph display target name is a URL name or client name displayed in a graph by selecting a line from a table. For details, refer to "11.2.5.2 Response analysis page ". |
The legend
Color codes for the graph and their contents are displayed.
If a string for explaining the content is too long, it is displayed in abbreviated form at the top of the graph. For information on the correct content, refer to the table.
Numeric axis (vertical scale)
The graph can be re-sized vertically by dragging on the top border with the mouse.
Operation | Result |
|---|---|
Drag up | Enlarged (The graduation markings are enlarged) |
Drag down | Reduced (The graduation markings are reduced) |
Double click | Scale automatically adjusted (reset to its initial size) |
Time axis (horizontal scale)
The graph can be re-sized horizontally by dragging on the right border with the mouse.
Operation | Result |
|---|---|
Drag to the right | Enlarged (The graduation markings are enlarged) |
Drag to the left | Reduced (The graduation markings are reduced) |
Double click | Scale automatically adjusted (reset to its initial size) |
Graph form
Specify this to change the type of graph displayed.
Note that the graph forms available for selection depends on the analysis type.
Previous period value box
The values for the previous period can be shown or hidden ('No display').
When you select from the drop-down list, values for the previous period are plotted as a line graph, depending on the selection.
Title line (Table header)
Displays the title of each column of the table.
Data line
The total data of the analysis period is displayed in descending order in default.
In the order column (the leftmost column), the graph legend is displayed in addition to the numbers.
For the following analysis page, a line selection can be made (by clicking a line) and the action is as listed below:
Analysis page | Action when a line selection is made |
|---|---|
Analysis page in which an advanced analysis can be made | A line selection can be made (A line can be clicked). An advanced analysis is performed by selecting an advanced analysis destination box. |
Analysis data type: response report | A line selection can be made (A line can be clicked). If a line selection is made, a graph of the selected line is displayed. |
Traffic total field
Displays the total of the accumulated data.
Advanced analysis destination box
Select the analysis method for the advanced analysis destination.
If you click the advanced analysis destination box after clicking a 'Data line' and select a destination from the drop-down list, a data analysis (advanced analysis) is performed and a graph or table is displayed.
The advanced analysis destination box is displayed only on pages where advanced analyses can be performed.
Number of lines of the table
Select here to modify the number of lines in the table of the analysis window.
Display Order
Sclect here to modify the display order of the analysis window.
Help
Sclect here to display the online help in addition to the analysis window.