The Web Site Trend Viewer is used for analyzing the usage of systems that are comprised of Web servers and proxy servers.
On the Web server and Proxy server, access information from the user is accumulated in the log file. From this log file, the Web site Trend Viewer can extract and analyze such details as URL, user (user name, IP address, host name, and ID set in Cookie), and time. This user-access analysis enables timely decision-making on the services constructed on your Internet/Intranet.
Point
If, for example, a page on employment information is published using the Internet, you can use the Web site Trend Viewer to readily find out which schools the students referencing the recruit page attend.
If a Proxy server is set up to reduce the network load, it is easy to determine whether the Proxy server setting is effective by analyzing the cache hit rate and traffic.
The Trend Viewer provides the following functions:
Site access analysis
Usage in terms of access to Web sites, such as the extent of access to Web sites, such as which pages are popular, who accesses Web pages and how often, and which links are used.
Site navigation analysis
Usage in terms of customer behavior, such as which page the customers view, how long they view each page, and how they navigate through pages.
The Web site Trend Viewer edits data on the usage of the Web server and Proxy server and displays it on the Web browser (Web page) in table or graph form. It can be used on any Web browser connected to the Web server and network.
Data types and periods can be analyzed from a variety of viewpoints; buttons on the Web page enable you to switch views easily. An advanced-analysis function is also provided so you can carry out analyses focused on specific URLs and clients.
The usage of the Web site Trend Viewer is roughly classified into the following two modes:
Display trend data by switching the analysis window according to the analysis type.
Use the regular report function to report regular analysis results such as daily reports and monthly reports.
The Web site Trend Viewer displays the results by switching the analysis window depending on the analysis type. For example, you can use the Trend Viewer to make the following analyses:
Web server
Analysis type | Analyzed Data type to be used |
|---|---|
to view a usage summary for the entire server | View a summary of the analysis results. The summary displays the following report data:
|
To find how popular the Web service is | View the session report. In the session report, the number of people who visited the site can be checked. Multiple accesses to a page from the same person are counted as one person. |
To find which page of the Web service is most popular | View the request report. In the request report, which pages are popular and which types of user view such pages can be checked. |
To find the order the Web services pages accessed by the user | View the page navigation report. In the page navigation report, you can see the order in which Web service pages are accessed. |
To find whether any unauthorized access or site link disconnection has occurred | View the error report. Errors detected by the server include access by unauthorized persons and missing links when such links are referenced on the site. Checking for the occurrence of such errors can enable uses to find of whether any unauthorized access or site link disconnection has taken place. Contents of errors that have occurred are displayed on the analysis window in the error report. |
Proxy server
Analysis type | Analyzed data type to be used |
|---|---|
To view a usage summary for the entire server | View a summary of the analysis results. The summary displays the following report data:
|
To know the validity of the number of sessions | View the session report. You can learn how many users in the Proxy server access external servers at one time |
To know the validity of URL for caching | View the request report. You can observe which external pages are accessed from within the Proxy server and who accesses most often. |
To know the validity of the caching amount | View the traffic report. You can observe how much data is received in response to accessing of external servers from within the Proxy server. Based on this result, you can decide whether improvement is required if the caching amount on the server is small. |
If you want to know caching effects | View the cache report. You can determine how effectively the cache definition on the server is working. You can examine the hit rate for cache information held by the Proxy server with respect to access to external servers from within the Proxy server or access from outside the Proxy server. |
You can make more detailed analyses by carrying out the above analyses focusing on the following methods:
Analysis method type | Description |
|---|---|
Client host name | Analyses are carried out using the host name obtained by converting the client IP address by using DNS as a key. Any IP address that cannot be converted by DNS is displayed as is without conversion. The client here is the following:
|
Client IP address | Analyses are made using the client IP address as a key. |
Authorization user name | If the Web server or Proxy server performs authorization, the user name for the authorization is used for analysis. |
User agent | Analyses are made using the browser used by the user to access the Web server or Proxy server as a key. |
Referrer host name | Analyses are made regarding through which links the constructed Web service is reached, using the referrer host name as a key. |
Referrer IP address | Analyses are made regarding through which links the constructed Web service is reached, using the referrer IP address as a key. |
Remote host name | Analyses are made on the Proxy server using the host name of the page accessed from within the Proxy server as a key. In the case of a Proxy server in reverse operation, to which Web server a request was made from outside is analyzed, using the host name as a key. |
Remote IP address | Analyses are made on the Proxy server using the IP address of the page accessed from within the Proxy server as a key. In the case of a Proxy server in reverse operation, to which Web server a request was made from outside is analyzed, using the IP address as a key. |
URL | Analyses are made using the URL name accessed from the client as a key. |
Entry URL | Analyses are made using URL as an entry point of the URL accessed from the client as a key. |
Exit URL | Analyses are made using URL as an exit point of the URL accessed from the client as a key. |
Referrer URL | Analyses are made regarding through which links the constructed Web service is reached, using the referrer URL as a key. |
URL extension | Analyses are made regarding which extension is accessed most often, using the extension as a key. |
Access ID | Analyses are made using ID set in Cookie as a key. If the user is authenticated by CGI on the Web server, setting ID in Cookie can make analyses in which users are identified. |
Subnet | Analyses are made using a subnet, which groups client IP addresses, as a key. |
See
For details on how to specify the analyzed data type and analysis method type, refer to "11.2 Analysis Window".
The Trend Viewer can output collected/accumulated information in the CSV file format. By entering this information for such OLAP/mining tool as "SymfoWARE e-Business Intelligence Suite", information can be utilized at a higher level; for example, analyses can be executed that combine data on the backbone system, enabling the more effective use of Web sites by your business.
The analysis results can also be printed for reference.
The Web site Trend Viewer supports the following log formats. Other logs can be analyzed if their log formats are defined.
For information on how to define log formats, refer to "4.2 Environment Settings for Usage Analysis" (Managed server) and "5.2 Environment Settings for Usage Analysis" (Management server)
No | Log format | Server name |
|---|---|---|
1 | W3C (CERN) Common log format | W3C httpd (CERN httpd) |
2 | Apache Common log format | Apache Web Server |
3 | Apache Custom log format | Apache Web Server |
4 | Microsoft IIS log format | Microsoft Internet Information Services |
5 | NCSA Common log format | Microsoft Internet Information Services |
6 | W3C Extended log format | Microsoft Internet Information Services |
7 | Netscape Enterprise Server Common log format | Netscape Enterprise Server |
8 | Netscape Enterprise Server Flexible log format | Netscape Enterprise Server |
9 | Netscape Enterprise Server Custom log format | Netscape Enterprise Server |
10 | Fujitsu InfoProvider Pro Common log format | Fujitsu InfoProvider Pro |
11 | Fujitsu InfoProvider Pro Extended log format | Fujitsu InfoProvider Pro |
12 | Netscape Proxy Server Common log format | Netscape Proxy Server |
13 | Netscape Proxy Server Extended log format | Netscape Proxy Server |
14 | Netscape Proxy Server Extended2 log format | Netscape Proxy Server |
15 | Netscape Proxy Server Flexible log format | Netscape Proxy Server |
16 | Netscape Proxy Server Custom log format | Netscape Proxy Server |
17 | Squid Common log format | Squid |
18 | Squid Native log (version 1.1) format | Squid |
19 | DeleGate Common log format | DeleGate |
20 | DeleGate Custom log format | DeleGate |
21 | DeleGate Default log format | DeleGate |
22 | Fujitsu InfoProxy Common log format | Fujitsu InfoProxy |
23 | Fujitsu InfoProxy Common log format | Fujitsu InfoProxy |
24 | Microsoft Proxy Server Webproxy log format | Microsoft Proxy Server |
25 | SQC Extended log format | Systemwalker Service Quality Coordinator |
Note
"SQC Extended log format" in No. 25 is a format of log files accumulated by collecting the SQC extended logs. For more details, refer to "11.4 SQC Extended Log Collection".
The Web Site Trend Viewer saves the log with the character code and LF(line feed) code according to the operating OS where it runs. The combinations are as follows:
[Windows]
Character Code | LF code |
|---|---|
ASCII | CR + LF |
[UNIX]
Character Code | LF code |
|---|---|
ASCII | LF |
Note
Normal operation is not guaranteed if the combination differs the above combinations. Notice should be paid especially when network file on a remote network is involved.
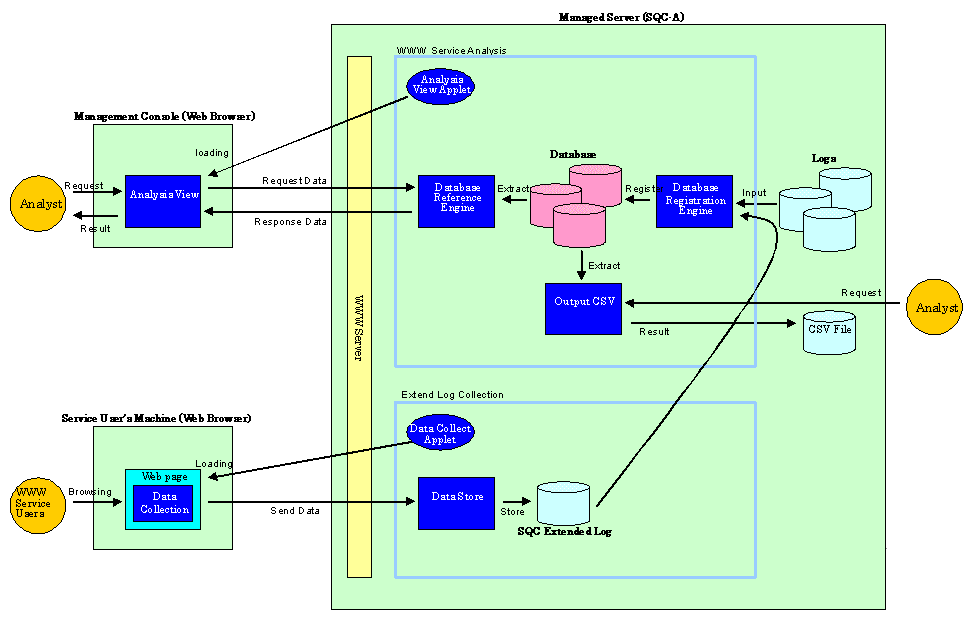
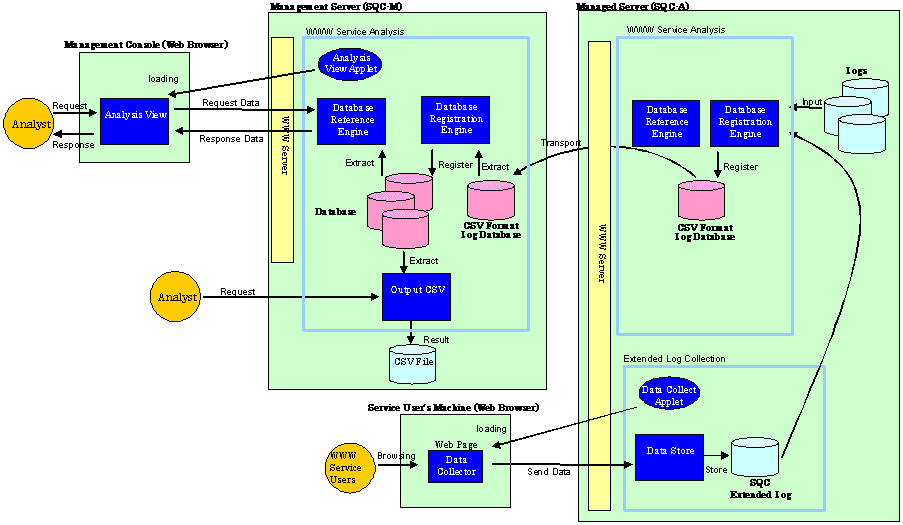
Web Trend Viewer is composed of the Web service analysis function and the extended log collector.
As shown in the following figures, two functional configurations of the Web site Trend Viewer are available; one for analyses made on the Managed Server, and one for analyses made on the Management Server.
Carry out analyses on the Management Server in the following types of operation:
The Web site is configured using multiple Web servers and the entire Web site should be analyzed.
Analyses should not be made in the DMZ.
Load on the Web server due to analyses should be avoided.
In the following figures, a Web server or Proxy server machine on which Agent for Business(SQC-A) is installed is called a "Managed Server", a machine on which Manager(SQC-M) is installed is called a "Management Server", and a person who carries out analyses is called an "analyzer".
Analyses made on the Managed Server
Analyses made on the Management Server
See
For information on the operational methods to use to make analyses on the Management Server, refer to "Chapter 3 General Procedure for Basic Installation".
Web Site Trend Viewer is used to perform availability analyses of Web services based on logs related to the Web service.
Web Site Trend Viewer includes the following features:
Usage DB Registration Engine
An engine on the Managed Server or Management Server that extracts data from various logs related the Web server and stores it in the database or Usage DB specific to this product.
Usage DB Reference Engine
An engine on the Managed Server or Management Server that retrieves data from the Usage DB. This engine provides the interface (using HTTP communication) to extract data from the Usage DB in response to a request from the "analysis window".
Analysis window
A GUI, running in a Web browser on the client machine, used to carry out data analyses and display results. Usage DB data edited in the interface of "Usage DB Reference Engine" is obtained and displayed in graph or table form.
Analysis report
A function used to display or output analysis results as regular reports. Clicking the "Trend Reporter" button on the "Web Site Management" window on the Management Server and then selecting a Trend Viewer report can use this function.
CSV output
A command, running on the Managed Server or Management Server, used to output Usage DB data to a file in the CSV format.
SQC extended log, a specific log adopted by this product, contains data on the response time of the CGI program viewed from the Web browser. Since the SQC extended log is one of a number of logs handled by the "Usage DB registration engine", its data can be referenced by "analysis window" and by "CSV output".
SQC extended log can be used, for example, when the search service via the CGI program is provided on the Web page, and the analyst needs to find out how long it takes to return search results to the Web page user.
Data collection function
A JavaTM applet for collecting the SQC extended logs. The applet is set for each Web page for which a SQC extended log is to be collected.
Data accumulation function
A CGI program for accumulating SQC extended logs. This function is called by using the data collection function to accumulate SQC extended logs.