The monitoring window is made up of a summary display, which allows the user to quickly grasp the operation status of the entire system, and the Drilled-Down display, which displays details when a problem occurs.
Starting
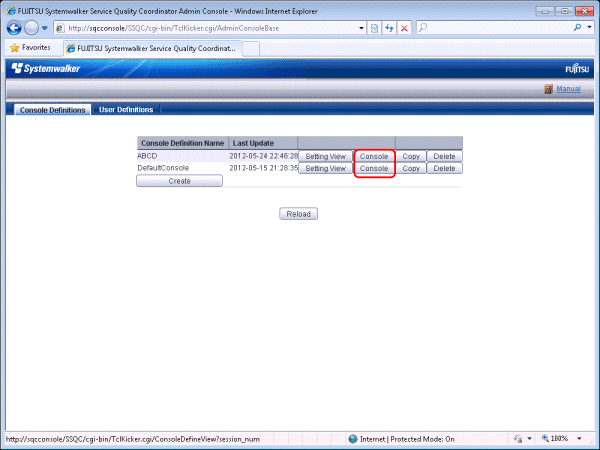
Start the Console by clicking the Console button on the Console Definitions tab of the Admin Console window.

The console window can also be started by specifying its URL.
Click on the Monitoring menu in global navigation in the Console to start.

Note
Do not perform operations in the monitoring window using the context menu that appears when the right mouse button is clicked.
Window configuration
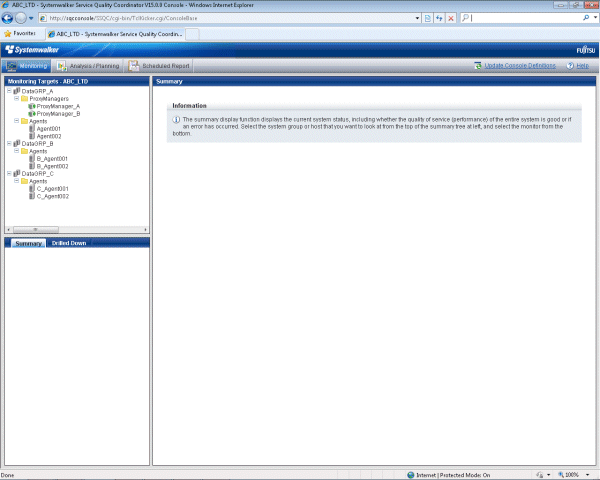
Once started, the following Monitoring window will appear.

Basic configuration
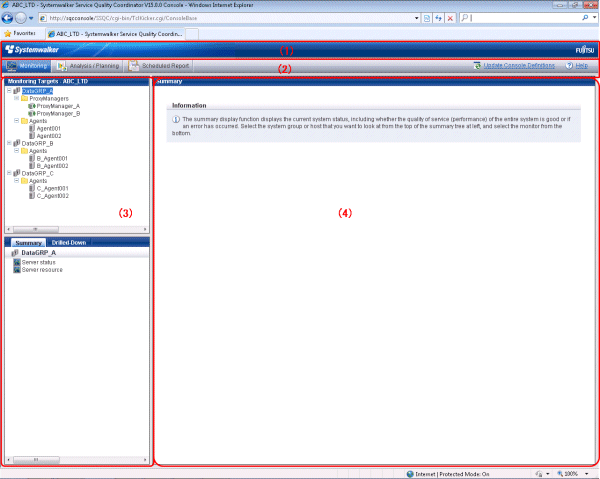
The Console is organized as shown in the following table.
Item No. | Component | Description |
|---|---|---|
(1) | Global Header | The Systemwalker and Fujitsu logos are displayed. |
(2) | Global navigation | Global Navigation provides the following menus:
|
(3) | Tree display area | The Summary view and the Drilled-Down display are displayed in tree structure. It is possible to switch between the two display functions by clicking the relevant tabs. By default, the Summary view will be displayed when the Console is first opened. |
(4) | Content display area | When a node in the tree is selected, the corresponding content of the Summary or Drilled-Down display will appear in this area. |
The Console provides two display functions: Summary view and Drilled-Down display.
These functions are explained in the following two sections.