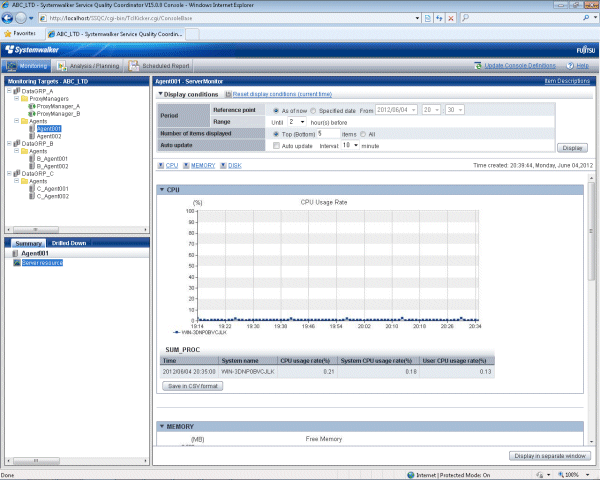
When the node indicating the monitor to be displayed is selected in the Summary tree on the left, the monitored content will be displayed on the right.
"Loading..." appears in the content display area while the content is being made.
While this message is displayed, the Update and Auto Update will be disabled.
The Monitor can be manually or automatically updated with the most recent information.
The options shown in the following table can be specified when performing the update process.
Option | Description |
|---|---|
Reference point | Select the reference point for displaying the Monitor. The following reference points can be selected: As of now, Specified date If As of now is selected, the Monitor will be displayed with the current time as the reference point. If the Specified date is selected, any time up to three days before the current time can be selected as the reference point. |
Range | Select the display range as the number of hours leading up to the present time or another specified time. The following display periods can be selected: 1, 2, 4, 8, 12, 18 and 24 hours The default period is 2 hours. |
Number of items displayed | For the number of display items, either "All" or an arbitrary number of items can be specified. Point When the number of display items is set, for performance information where high performance values can cause problems (e.g., with CPU usage), high numbers are shown, and vice versa. The number of data items to display in the report is about up to10. The graph might collapse by explanatory notes in case of 10 or more. |
Auto Update/Interval | To perform updates automatically, select the interval and check the check box. The following update intervals can be selected: 1, 3, 5 and 10 minutes The default value is 10 minutes. The count of the update time starts when the check box is checked. Moreover, the count starts again at that time when the update time is changed when the auto update is done. Note that if the current content of the Monitoring view is still being displayed when the next automatic refresh is due, then this next refresh will be skipped, and the content will be updated with the following refresh. Please remove the check on the check box when you stop the auto update. |
To remove the need to specify the same option many times, once an option ([Reference point], [Range] and [Number of items displayed]) is specified, it is inherited by other monitors.
Point
If it is necessary to open multiple Consoles to display different types of monitors at the same time and view them at different automatic update intervals, and if Internet Explorer is the browser being used, the different options can be specified by starting Internet Explorer separately from the Start menu.
Note
The summary data for Agents that is held in the PDB is the summary data that has been received from the Agent for (up to) the latest retention period. The summary window in the Admin Console displays the summary data held in the PDB, so if an Agent is stopped, there may be differences in the display period, as compared to other Agents that are running.
Note
The following problems sometimes occur when users try to display the desired contents (graphs or tables).
The operation may terminate with error code 1572864.
"Chart is unavailable" is displayed instead of the graph image.
The graph image may be left out (only graphs are not displayed).
The following error message may be displayed:
"The specified CGI application misbehaved by not returning a complete set of HTTP headers. The headers it did return are: Unable to register TclNotifier window class" "ohd_update error." "Ohd file create error." |
These problems may be due to insufficient space in the desktop heap for the operation management client. Increase the size of the desktop heap by referring to "6.1 Content Display Errors".
When a problem is discovered with the monitor, open the respective Drilled-Down display by clicking on the Drilled-Down tab with the monitor displayed, and then selecting the detailed view icon in the Drilled-Down display tree.
By clicking on the Display in separate window button in the lower right of the summary window, the monitor content in the current view is opened in a separate window.
This makes it possible to display another monitor in the console for comparison.
When the window is displayed separately, that window can then be printed by clicking the Print button.