This chapter explains the Operation Management Client console.
This is the main window of the product. It is composed of the global header, the global navigation bar, and a display area.
The display area contains the following three types of display, which are explained in chapters 3 and 4:
Monitoring window
Analysis/Planning window
Scheduled Report View
Starting the Console
The Admin Console window is started by specifying the following URL in a Web browser.
http://Host name for operation management client/SSQC/AdminConsole.html |
Or
http://host name of the operation management client/SSQC/XXX.html |
The "XXX" part of the second URL is a user name that has been registered in "1.3 User Definitions Window".
To enter user names, first make basic authentication settings for each user by referring to "How to Set Up Basic Authentication for Operation Management Clients" in the Installation Guide.
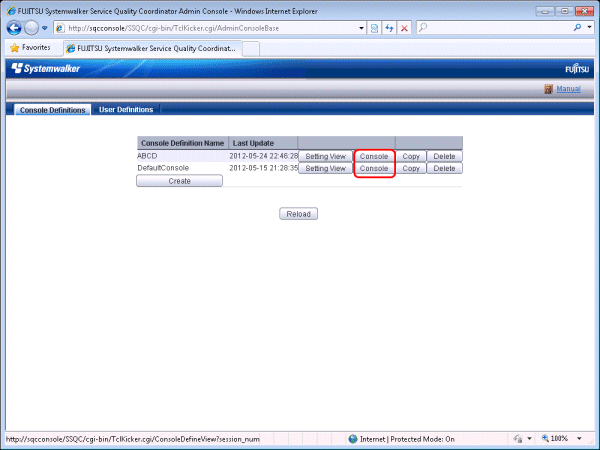
To start the Console from the Admin Console, click on the Console button on the Console Definitions tab of the Admin Console window.
Note
If the browser is equipped with a pop-up blocking function, the Console will not open in a separate window. The pop-up blocking function should be disabled in such cases.
The Console uses JavaScript. If JavaScript is not enabled, the Console will not open in a separate window. JavaScript should be enabled in such cases.
Do not use the pop-up context menu that is displayed when the right mouse button is clicked to perform operations on the Console window.
When the Console is started, the message below might be displayed.
About the graphs
The graphs displayed in the console have the following peculiarities.
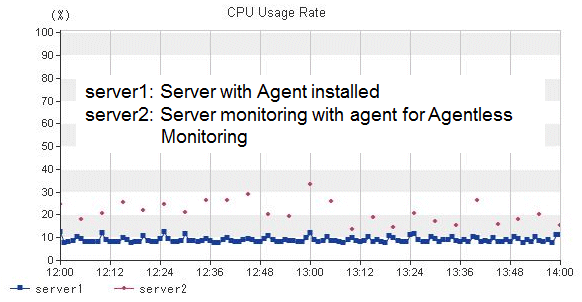
When you display in line graphs information collected at different intervals from different agents (for example information from a server with an Agent installed and information from a server being monitored by an agent for Agentless Monitoring), the display may be affected. Create system groups of Agents that have the same collection intervals.
Example
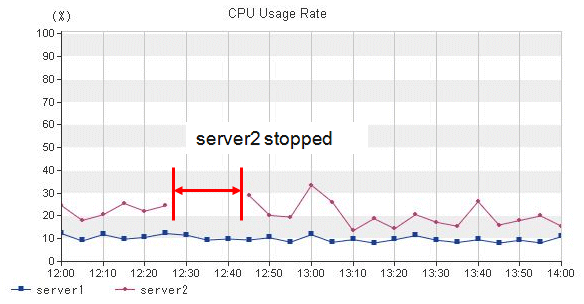
In the summary view, when multiple Agents are displayed in a line graph and some of the Agents have been stopped, the times when they are stopped are not displayed.
Example
In the summary view, when all monitored Agents have stopped and information is not being collected, the times when performance information is not being collected are not displayed in the line charts and area charts.
Example
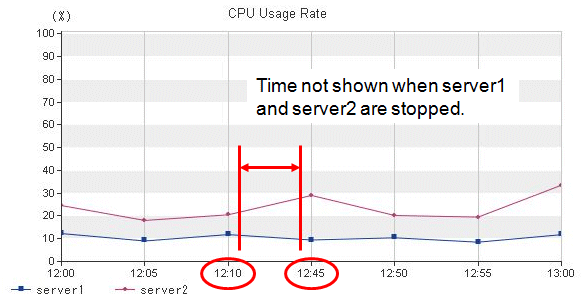
In the analysis/planning window and Scheduled Reports window, when Agents have stopped, the performance values at times when they are stopped are not displayed in the line charts and area charts.
Example
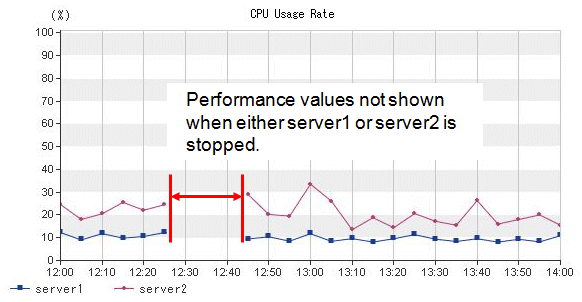
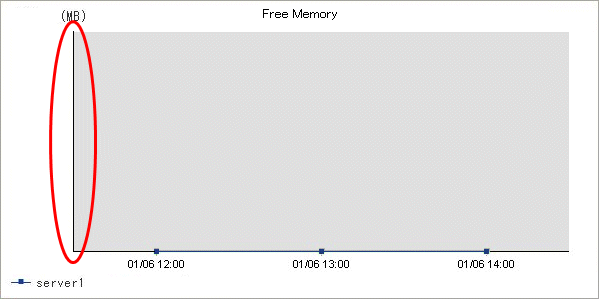
In graphs other than those showing percentages in the full system inspection analysis/report and categorized diagnostic analysis/report, and in graphs in the detailed analysis/report, values may not be shown in the vertical axis of the graph.
Look at the values in the tables to confirm.
The above condition occurs when the performance values in the specified period are constantly "0".
Example
