Agents are components that collect performance information from monitored servers.
Agents come in the following two types:
Agent for Agent-based Monitoring
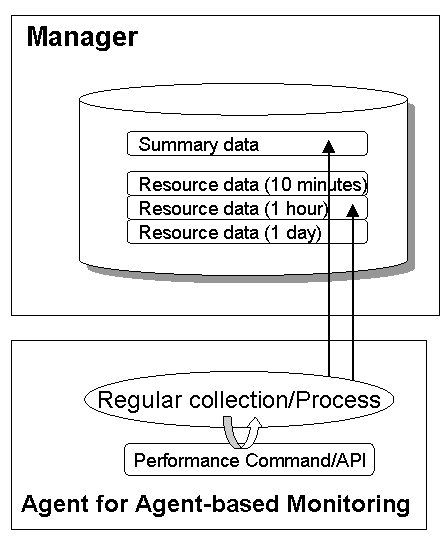
An agent is installed on the monitored server and collects performance information by periodically issuing commands or APIs provided by the operating system or middleware.
Agent for Agentless Monitoring
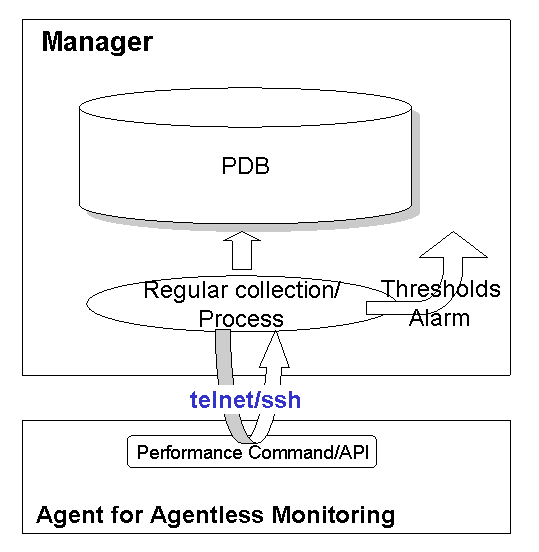
The agent for Agentless Monitoring is not installed on the monitored server, but remotely collects performance information by periodically issuing commands or APIs provided by the operating system or virtualized software of the monitored server.
When referred to simply as "Agent" in this manual, Agents for Agent-based Monitoring are being referred to.
The following table compares the differences between agents for Agent-based Monitoring and agents for Agentless Monitoring:
Function | Agent for Agent-based Monitoring | Agent for Agentless Monitoring | |
|---|---|---|---|
Performance information collected | Collects performance information on the OS, Web, AP, and DB (*1) Collection intervals are between 1 and 10 minutes (1 minute for the OS) Because the Agent and Manager operate synchronously, collection is essentially real-time and information is displayed in the summary screen. Even if the system load of the server where the Agent is becomes high, performance information can still be collected to some degree. | Collects summary information for the OS (CPU, memory, disk, etc.) and performance information for virtual resources. Collection interval is 5 minutes The Agent and Manager operate asynchronously, so it can take 10 to 15 minutes for collection and the information is displayed in the summary screen. If the system load becomes too high and communication through telnet and ssh becomes impossible, performance information may not be collected. | |
Threshold monitoring | Linking with Systemwalker Centric Manager | The Agent will be the server generating the threshold alarm Definitions for threshold monitoring are made on the Agent | The Agent will be the server generating the threshold alarm Definitions for threshold monitoring are made on the Manager/Proxy Manager |
Event log/syslog | The Manager/Proxy Manager will be shown as the server generating the threshold alarm even though the actual origin of the alarm is the Agent Definitions for threshold value monitoring are made on the Manager/Proxy Manager | ||
Trap | |||
Executed by user command | |||
Troubleshooting log | Output | Not output | |
*1: Items that can be collected depend on the installation type.
Agents for Agent-based Monitoring collect performance information by periodically issuing commands or APIs provided by the operating system or middleware.

The information collected by Agents is transformed into summary data and resource data and sent to a Manager.
Summary data is summarized data for gaining a general understanding of the state of the system. For example, memory or CPU usage for the entire system falls into this category.
Resource data is detailed data that is collected for each resource. For example, the CPU usage for each processor or the data for each process falls into this category. Resource data is further processed into three types of data (for different display objectives) and sent to the Manager.
The rest of this section explains the roles of the directories that are used when Agents run.
DsaForwarder / DsaForwarder_sum directory
These directories are used to temporarily store data to be sent to a Manager. The DsaForwarder directory is used to store resource data and the DsaForwarder_sum directory is used to store summary data. If the Manager is in a redundant configuration, additional directories named "DsaForwarder2" and "DsaForwarder_sum2" are also used.
If communications with the Manager are broken, data will be stored in these directories until communications recommence.
Note
If the communications interruption continues for a long time, unsent data will place pressure on the disk capacity. As the amount of available disk space decreases, first a warning event will be output, then an error event, and finally the DCM service or the dcmd process of the Agent will stop running.
Note, however, that even if there is sufficient space available on the disk, if the number of unsent data files exceeds a specified level (approximately 3,000), files with the oldest dates will be automatically deleted every 60 minutes to reduce disk usage. Once files are deleted, performance data for the deleted period will be lost.
If accumulated files are no longer required, they can be deleted manually using the procedure described in "Deleting Unsent Agent/Proxy Manager Data".
The specific location for this directory is as follows:
Windows
Variable file directory\transfer\DsaForwarder Variable file directory\transfer\DsaForwarder_sum |
UNIX
/var/opt/FJSVssqc/temp/DsaForwarder /var/opt/FJSVssqc/temp/DsaForwarder_sum |
Troubleshoot directory
Server performance information that is collected by the Agent is transformed into CSV files and stored as log data. The information recorded here is more detailed than the information stored in the database on the Manager. This information is stored in order to allow more detailed troubleshooting to be performed.
The specific location for this directory is as follows:
Windows
Variable file directory\spool\Troubleshoot1 |
UNIX
/var/opt/FJSVssqc/Troubleshoot1 |
Past log files
The following file will be output to the Troubleshoot directory:
troubleshoot1_%SYSTEM%_%N%.txt |
%SYSTEM%: System name
%N%: File number
This log file will be newly created every 24 hours. The file number (%N%) will cycle from 1 to the value of the Troubleshoot retention period and then back to 1 again.
Log file of the current day
The following file will be output to the Troubleshoot directory:
troubleshoot1.wrt |
Note
troubleshoot1.wrt contains the log data that is currently being stored, so to display the stored log data of the current day, copy troubleshoot1.wrt to a file of a different name and display the contents of the copy, not the original.
Point
This log file is in CSV format. Refer to "Log Data (Troubleshooting) Information" in the Reference Guide for information on data formats.
The agent for Agentless Monitoring is not installed on the monitored server, but remotely collects performance information by periodically issuing commands or APIs provided by the operating system or virtualized software of the monitored server.

Information collected is processed into summary data and resource data by the Manager and stored in the PDB.
Communication is performed between the monitoring server and monitored server (agent for Agentless Monitoring) by one of telnet, ssh or https when remotely collecting performance information. Refer to "Management with an Agent for Agentless Monitoring" in the User's Guide for details on conditions and settings.