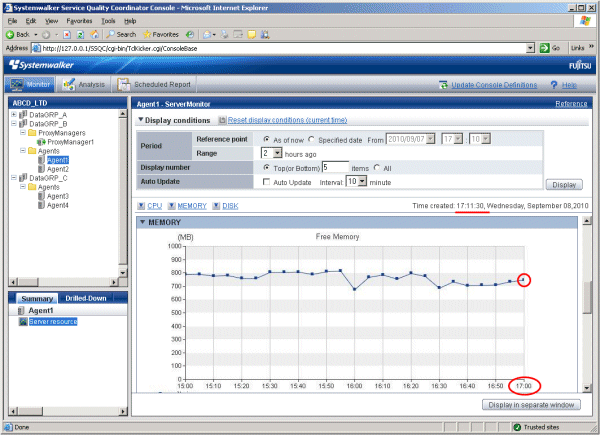
OS performance information collected by an agent for Agentless Monitoring can be displayed as follows.
Performance information can be displayed by selecting the "Server resource" node (ServerMonitor) in the Summary tree.
Performance information can be displayed by selecting the Windows, Solaris, Linux, AIX, and HP-UX nodes in the Detailed tree.
Full system inspection analysis/report
Categorized diagnostic analysis/report
Detailed analysis/report
Note
The full system inspection analysis/report and categorized diagnostic analysis/report can show reports that have "Windows" or "UNIX" in the report title. They cannot display the "Windows process" and "UNIX process" reports, however.
When this data is to be displayed in the summary view, it will take 10 to 15 minutes for the data to appear.
This is due to the way that the data is collected by the agent for Agentless Monitoring, as described below.

Data for 17:00, for example
17:00 | Begin collection |
17:05 | End collection |
17:10 | Manager/Proxy Manager collects the data |

The first data will appear 15 to 20 minutes after starting the Manager/Proxy Manager service because the script is sent to the monitored server at the timing of the first collection.