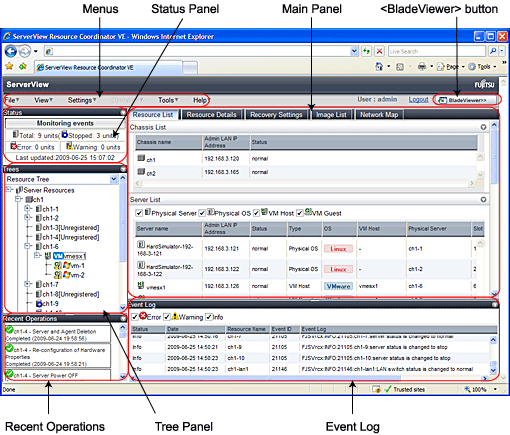
This section explains how the RC console is organized.
Figure 2.1 RC console

Operations can be performed either from the menu bar or popup menus.
The Status Panel displays the status of managed servers.
If a warning or error event occurs on a managed server, the status monitoring area starts to blink.
The Tree Panel provides two types of trees: a resource tree and a VLAN tree.
The resource tree is also split between three sub-trees: one for server resources, one for network resources, and one for power monitoring devices.
The resources below are shown in a tree view. A status icon is displayed over each resource's icon.
- Chassis
- Server
- Physical OS
- VM host
- VM guest
- LAN switch
The resources below are shown in a tree view. A status icon is displayed over each resource's icon.
- LAN switch (excluding LAN switch blades)
The following power monitoring devices are shown in a tree view.
- PDU
- UPS
Selecting a VLAN ID shows a list of resources on which this ID has been applied to.
Chassis
Server
VM host
VM guest
LAN switch
NIC
LAN switch port
The Main Panel displays information on resources selected in the tree.
[Resource List] tab
Displays information on resources related to the resource selected in the resource tree.
[Resource Details] tab
Displays more detailed information on the resource selected in the tree, or on a resource that was double-clicked in the [Resource List] tab.
[Recovery Settings] tab
Displays information on the spare servers assigned to the resource selected in the resource tree.
[Image List] tab
Displays system and cloning image information.
[Network Map] tab
Displays a network diagram of registered resources.
Displays the progress statuses and results of operations performed in Resource Coordinator VE.
The Event Log displays information on events that have occurred.
It displays a log of events that have occurred on managed resources.
Opens the BladeViewer interface.
BladeViewer is a management interface specially designed for blade servers. It can only be used in conjunction with PRIMERGY BX servers.