When the ETERNUS disk storage system icon is dragged and dropped to the performance management window, a storage logic configuration tree will be displayed as below.
"AffinityGroup" indicates a number of the zone functionality of the selected storage system.
"LUN" indicates a logical unit number from the point of view of the server node. Since this is allocated with Logical Volume (OLU and LUN_V) that specifies a number unique to a device managed in the device, this is expressed as "LUN X(Logical Volume X)" in the tree.
"RAID Group" located under "LUN" indicates that LUN is included in "RAID Group" (rank). [Disk](=physical drive) under [RAIDGroup] or [RAIDGroup [X- X]] indicates the drive used to configure the rank. [LogicalVolume] under [RAIDGroup] or [RAIDGroup [X- X]] indicates the numbers of other LogicalVolumes that belong to the same RAIDGroup. [RAIDGroup X- X] also has devices that are not shown.
The properties are displayed as tool tips. For details about items that can be checked in these tool tips, refer to "B.10.3 The tree view".
Figures beginning with "0x" are values expressed in hexadecimal notation. Other numbers are decimal numbers.

From the device tree in the Performance Management window, select the number of the LUN or RAID Group whose performance information you want to display, right-click to display a popup menu, and select [Show Performance Graph].
You can select multiple numbers. To do so, click LUN or RAID Group while holding down the Ctrl or Shift key, right-click and slect [Show Performance Graph].
The dialog shown below appears. In the dialog, select the graph window to be displayed.
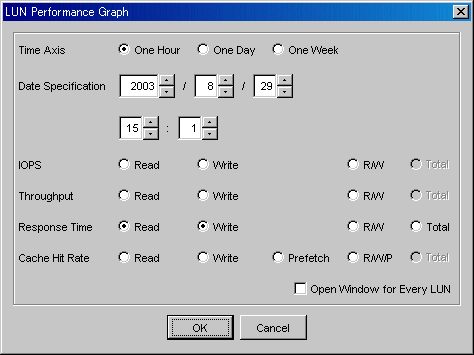
Time Axis | Select the time interval for a graph that you want to display. Select one hour, one day, or one week. |
Date Specification | Specify the date and time to be displayed in the center of the graph. The current time is displayed. You may select the date and time of a graph that you want to display. A period of up to 7 days can be specified. |
IOPS | Indicates how many times I/O is issued per second. |
Throughput | Displays a data transfer rate (MB/S). |
Response Time | Displays an average I/O processing time (ms). |
Cache Hit Rate | Displays a ratio (%) at which cache is hit. |
Note
When RAID Consolidation is performed in ETERNUS6000 the RAIDGroup response time will not be displayed.
LogicalVolume(LUN) and RAIDGroup performance information including LogicalVolume, created by LUN Concatenation in the ETERNUS8000 and ETERNUS4000 (except models 80 and 100) that firmware versions are before V11L40, will not be displayed.
The ETERNUS disk storage system main frame volume and performance information about MVV/SDV are not supported. The value for the performance information about the RAID Group containing SDV also cannot be guaranteed.
For the IOPS, Throughput, and Response Time, one of the following three can be selected: (1) displaying a READ graphic window, (2) displaying a Write graphic window, and (3) displaying one graphic window where R/W (Read and Write information) items are displayed at the same time. Read and Write can be selected at the same time but, if R/W is selected, the individual Read and Write graphic windows cannot be selected.
For the Cache Hit Rate, one of the following four can be selected: (1) displaying a Read hit-ratio graphic window, (2) displaying a Write hit-ratio graphic window, (3) displaying a pre-fetch hit-ratio graphic window, and (4) displaying one graphic window where all R/W/P information (Read, Write, and Pre-fetch hit ratios) is displayed at the same time. Read, Write and pre-fetch can be selected at the same time but, if R/W/P is selected, the individual Read, Write, and pre-fetch graphic windows cannot be selected.
If multiple logical units are selected be displayed on a graph, "Open Window for Every LUN" is displayed. Select it to open one graph window for each LUN.
If it has not been selected, "Total" is displayed in the dialog. If you select "Total", the "Total" graph appears. Otherwise, the information about multiple units is displayed in the same graph window. If "R/W/P" or "R/W" is selected, "Total" must be selected.
From the device tree view in the Performance Management window, select the number of the disk whose performance you want to display, right-click to display a popup menu, and select [Show Performance Graph].
You can select multiple disks. To select multiple disks, click multiple disks while holding down the Ctrl or Shift key, right-click and select [Show Performance Graph].
The dialog shown below appears. In the dialog, select the graph window to be displayed.
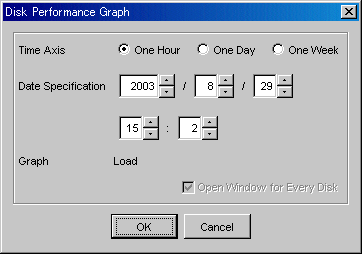
Time Axis | Select the time interval for a graph that you want to display. Select one hour, one day, or one week. Refer to "7.1.2 Performance Graph Window Types" for details. |
Date Specification | Specify the date and time to be displayed in the center of the graph. The current time is displayed. You may select the date and time of a graph that you want to display. A period of up to 7 days can be specified. |
If multiple logical units are specified for displaying a graph, "Open Window for Every Disk" is displayed in the dialog. If you select it, one graph window opens for each disk. Otherwise, the information about multiple disks is displayed in the same graph window.
To display the performance graph, select the module (CM, CA, CMPort, DA) from the performance management window and use a right mouse click to display the pop up menu, and then click on [performance graph display]. Multiple modules can be selected by holding down the [Ctrl] key or the [Shift] key while clicking on the modules. When DA is selected the DA Performance Graph dialog shown below is displayed and when CA or CM Port is selected their respective performance graph dialogs will display.
From the performance graph dialog, select the options for the particular graph you wish to be displayed in the graph window.
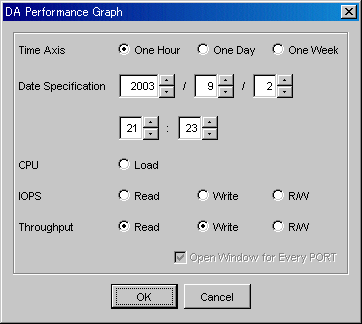
Time Axis | Select the time interval for a graph that you want to display. Select one hour, one day, or one week. |
Date Specification | Specify the date and time to be displayed in the center of the graph. The current time is displayed. You may select the date and time of a graph that you want to display. A period of up to 7 days can be specified |
CPU | Displays the CPU usage (%) of DA or CA. |
IOPS | Displays the number of I/O issued per second of DA, CA port, or CM Port. |
Throughput | Displays the data transfer volume (MB/S) of DA, CA port, or CM Port. |
Information
The CPU usage can be only displayed when the selected storage device is ETERNUS6000.
When CM is selected the following CM Performance Graph will display.
A chart window can be selected on this dialog.
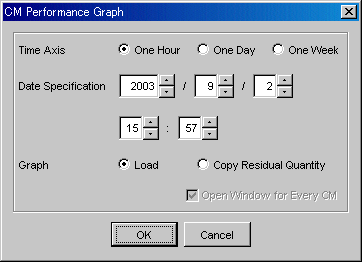
Time Axis | Select the time interval for a graph that you want to display. Select one hour, one day, or one week. Refer to "7.1.2 Performance Graph Window Types" for details. | |
Date Specification | Specify the date and time to be displayed in the center of the graph. The current time is displayed. You may select the date and time of a graph that you want to display. A period of up to 7 days can be specified. | |
Graph | Load | Displays the CPU usage (%) of CM module. |
Copy Residual Quantity | Displays the remaining copy volume (GB) of advanced copy (EC/OPC). When both EC and OPC are operating, a total of the remaining copy volumes of EC and OPC is displayed. | |
Information
For the ETERNUS4000 models 80 and 100, ETERNUS3000 (except model 50), and GR (ETERNUS GR720 and higher), the CA Performance Graph dialog box does not display Copy Residual Quantity data.
Selecting "Open Window for Every Port" and "Open Window for Every CM" on the dialog when multiple items are selected displays chart windows for respective modules.
To display the performance graph, select the storage device from the performance management window and use a right mouse click to display the pop up menu, and then click on [performance graph display].
The dialog shown below appears. In the dialog, select the graph window to be displayed.
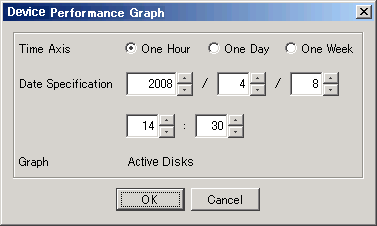
Time Axis | Select the time interval for a graph that you want to display. Select one hour, one day, or one week. Refer to "7.1.2 Performance Graph Window Types" for details. |
Date Specification | Specify the date and time to be displayed in the center of the graph. The current time is displayed. You may select the date and time of a graph that you want to display. A period of up to 7 days can be specified. |
The performance information for the number of active disks can be managed by setting to perf.conf file. For the settings, refer to "C.4 perf.conf Parameter".
Note
When the specified ETERNUS disk storage system has no Eco-mode function, the number of active disks graph is not displayed. For the ETERNUS disk storage systems that have the Eco-mode function, refer to "1.3.4 Energy-saving operation for storage device".
Before the displaying the performance information for the number of active disks, it is necessary to upgrade to the firmware that supports the Eco-mode operation and change the composition of the device. For the details of those procedures, refer to "7.2.11 Updating configuration information".