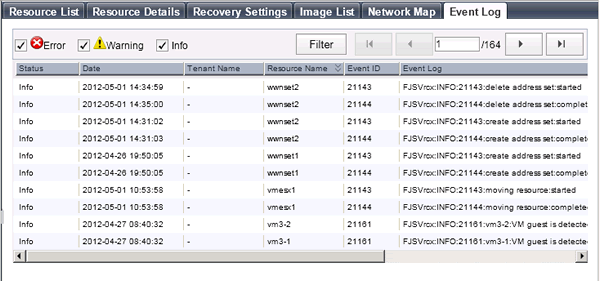
This section describes the event area of the ROR console.
Figure A.7 Event

The event log displays a history of events that have occurred on managed resources. These events are added to the log automatically.
Each event provides the following information.
Event Information
Displays the level of the event.
There are three levels: "Error", "Warning", or "Info".
Date and time at which the event occurred.
Name of the tenant associated with the event.
Name of the resource associated with the event.
Identifier related to the event.
No event ID is displayed for network resources.
Content of the event.
When the link in the [Event Log] column is clicked, an error dialog is displayed. The error dialog provides detailed information of events.
Events can be filtered using the checkboxes displayed in the window.
Selecting a checkbox will show the events whose status corresponds to that of the selected checkbox. Clearing a checkbox will hide such events.
When <Filter> is clicked in the window, the [Filter Settings] dialog is displayed. The following conditions can be set for the events displayed in the list:
Tenant
Event Log
Date
The conditions set for events are displayed above the list. To clear the conditions, click <x> displayed on the right of the list.
Clicking a column heading will change the color of the selected column and sort events in either ascending or descending order.
In each page of the list, 10 items can be displayed. It is possible to specify the page to display, move forwards and backwards by single pages, and move to the first or last page.
Note
When a resource's status becomes "fatal", its related event shows an "Error" status in the [Status] column. For this reason, the actual status of a resource should be confirmed from either the resource tree or the [Resource List] tab.
Information
For the SPARC Enterprise T series, the following levels are displayed for SEVERITY values of hardware SNMP Trap MIBs (SUN-HW-TRAP-MIB.mib).
When SEVERITY is Critical or Major:
"Error" is displayed.
When SEVERITY is Minor:
"Warning" is displayed.
When SEVERITY is Informational:
"Info" is displayed.